Do you want to beat the index with just a few lines of code? You don’t even need to program it. It’s simple enough to do manually. Beating the index is probably not the right term though. Killing it might be a better word.
Beating the index is supposed to be very difficult. After all, around 80-90 percent of all mutual fund managers fail to beat the index. If you think I just made that number up, you should follow the S&P Active Versus Passive (SPIVA) reports. If more people read those, fewer people would be investing with mutual funds.
In all fairness to the mutual fund managers, they start out in an impossible situation. They have steep costs to cover so they start far behind the index, and then they’re supposed to catch up during the year while staying within a very narrow tracking error budget.
If you’re not bound by such chains however, it shouldn’t really be that difficult to beat a stock index. Sticking with the theme I started last week, and followed up a few days later, I’ll continue to use the simplest possible approach. The trading model below can be greatly improved upon, but I want to demonstrate it in this simple shape to show that it still works.
We’re still dealing with 12 month momentum, but this time using single stocks. The investment universe is the S&P 500 stocks. We’ll go long anything where the current price is above the price a year ago. Simple ATR sized position are used, and we keep buying until we run out of cash. Yes, this introduces a random factor but if you run the model a few times with different randomization you’ll see that it doesn’t seem to matter much.
Let’s summarize the rules before showing the results:
- If yesterday’s close is higher than the close one year earlier, buy.
- Position size is based on 50 day ATR.
- Every Friday we check if the price is still higher than a year earlier or not.
- No leverage. Long only.
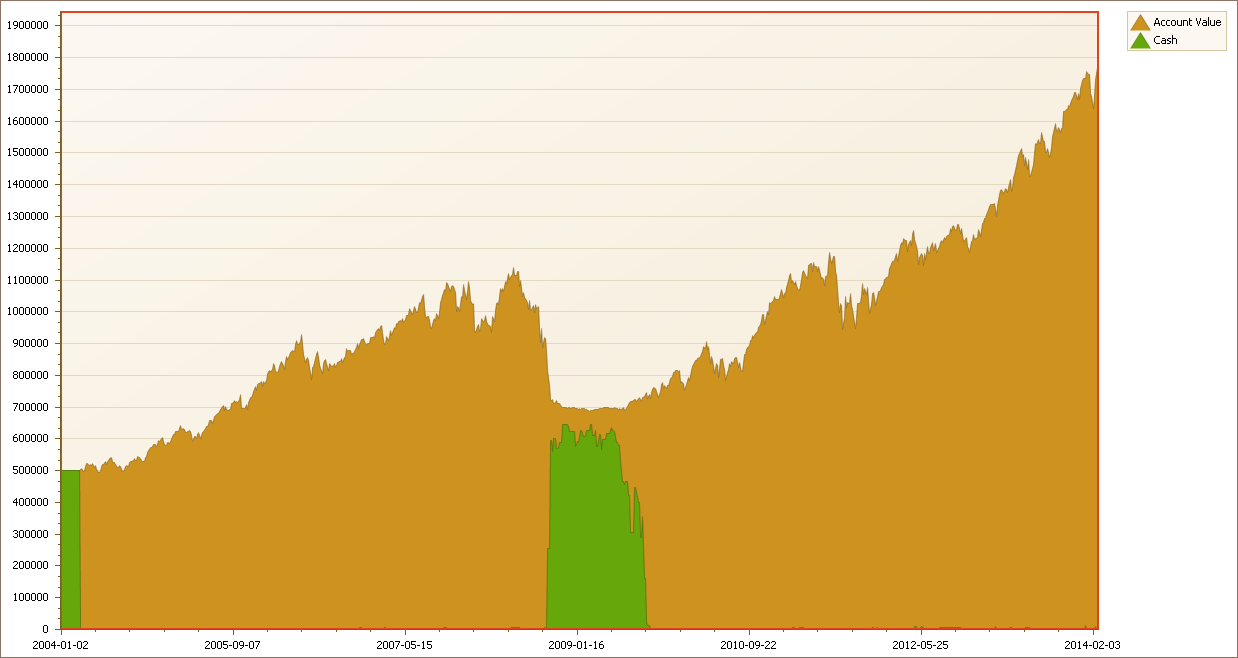
Equity Curve – 12 Months Momentum on S&P Stocks
Not that bad for such simple rules. We do see a bit of a scary dip in 2008, but I can promise you that it was a much more scary dip in the index itself. Note the green area by 2008/2009. That’s when there was just no stock available where the price was higher than a year earlier, and therefore the strategy held cash.
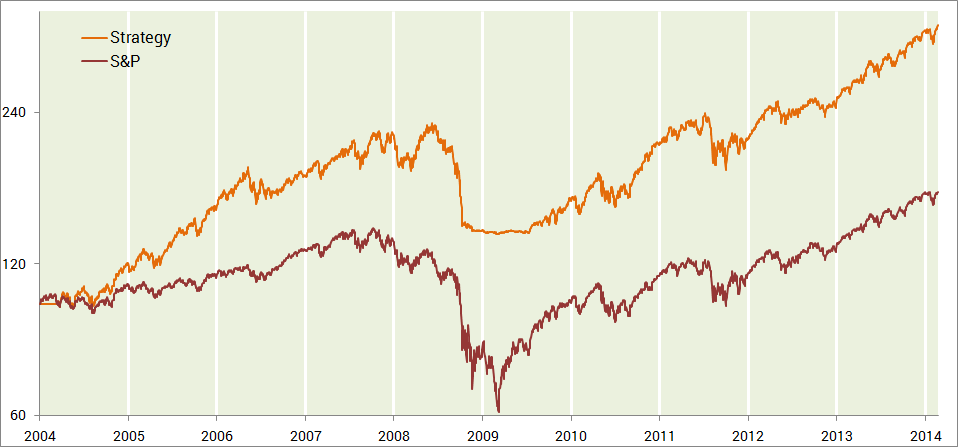
12 Months Momentum vs Index
A comparison to the index shows that you would be quite far ahead using this simple 12 months momentum rule.
Now, let’s be clear that I don’t really recommend that you trade this model. This is just a demo meant to show you that you don’t have to over-complicate things. This is just a way of breaking down trend following to the simplest possible components, to see if it still gets the job done. It appears as if it does.
While this model seems to work, it shouldn’t be that difficult to improve upon it. It has a few obvious weaknesses and perhaps you can use this as a starting point for a more realistic model.


Just for the sake of clarity, you have only one position per instrument, volatility sized at 0.05% of account capital? Other minor tweaks I would experiment/test with are: 1) trading long only; 2) using an ATR trailing stop for exits; 3) buying only stocks making all time highs. Still, as I get it, the model requires considerable capital, otherwise the “random” factor of not picking up some stocks for lack of capital would be too great. Also, it’s interesting that the equity curve looks quite correlated with the index. I wonder if the result could be replicated trading the index instead (as it’s sort of a trend following strategy), even though they are different “instruments”.
Yes, that’s correct. Making this model better is quite easy, but I wanted to keep it dead simple as a demonstration.
Hi Clenow
how does your momentum strategy in stocks on the move compare to this 12 month momentum as it is.
It seems the 12 month momentum is a watered down version of the equity momentum in SOTM but the performance profile here looks like its more or less the same result.
Hoping tp hear from you soon
The big picture concept is similar, but the model presented in this article isn’t very practical. I wouldn’t expect anyone to really manage money like that. This article was mostly meant as a demonstration of a concept, to make a point. Not to suggest an actual implementation.
Thanks Andreas,
Interesting.
Just did a quick 40-week MA long-cash on SPY, similar to Faber’s method, except weekly rebalanced.
I also beats the index with much lower volatility (high ret/risk)
No sizing, just reinvest profits.
It goes:
if weeklyclose40-week MA, buy at the next open
Chart here: http://tinyurl.com/plzhnum
Dividends not included.
Cash could be moved to T-bill to increase returns.
Correction about my last post: increase ret/risk only, not return
Me again 🙂
I wanted to actually compare a 52-w RS on SPY to Andreas’ study.
Condition: if 52-week SPY RS>0, long, cash otherwise
Beats B&H, better ret/risk.
Chart here: http://tinyurl.com/plzhnum
Even more simple than simple moving averages. Great research.
I would love to see the results over a longer timeframe. For example the “choppy” seventies or the `87 crash.
What would happen if you add a value filter like “going long a high book to price ratio? ” or relative strength? (http://www.institutionalinvestor.com/Article/3315202/Asset-Management-Equities/The-Great-Divide-over-Market-Efficiency.html?ArticleId=3315202&p=4#.Uyw204VgGYC)
Did a combination of both “relative strength” and “value” offer diversification?
Another idea is to require a simple filter on the Rate of Change so
BUY if 52-week Rate of change > 10%
EXIT LONG if 52-week Rate of change < 0
In this way we can filter some false signals, less trades, more qualified trends. Less commissions… etc.
RR
Andreas. This is interesting. Is there an ETF out there that filters on the universe of positive momentum among S&P (or other groups) stocks?
Quite possibly, Tom, but I’m not aware of any. I am however planning on covering this in the future. My plan is to write more on stock trading strategies later on, and to provide stock screening based on my vola adjusted momentum filters.
Hi Andreas, I think that your second book should be about stock systematic trading for trend followers. 🙂
What do you think?
Tom Cooper
Don’t tell anyone, Tom, but that book is about half way complete.
What do you mean, public forum..?
God bless you, sir! I can’t wait! Your books will become textbooks for students of markets. 🙂
Tom Cooper
Hi Andreas.
I was going through your premium content wanting to suscribe to your equity model in SOTM when I discovered another named: Absolute Momentum model. Is this model based on this article? What is the difference between that model and the one in SOTM. I see there is a documentation page but can’t acess it since it’s for premium users only.
Hi Michael,
The absolute momentum model is a variation which is likely of greater interest to professionals. It uses an absolute momentum floor as criterion instead of an index filter. It has a little deeper drawdowns, but higher returns. It doesn’t suffer as much during sideways markets and it’s likely a more realistic model for most asset managers.
I intend to publish the source code for this and other models soon, but probably just for the premium subscribers.
Hi Andreas.
Thanks for the usual quick replies. I just subscribed for the Momentum Equity Model and I was wondering if you have an email where you can be contacted directly. Thank you once again.
Hi Andreas,
I have a suggestion — yes, I know, it sounds a bit presumptuous … but please bear with me for a moment :-).
Suppose you took one of your favourite algos that you run on diversified futures and ran it on artificial data, obtained by simulating a geometrical Brownian motion random walk? Would it still work? Would it work with Gaussian-distributed returns? Or would the return PDF have to have fat tails? Or jumps?
I suppose with your programming skills and the simulation environment that you are using it would be relatively easy for you to carry out such an investigation, although I perfectly realize how very busy you must be. But it the results could give some interesting insight into why trend following works.
On the other hand, you have probably already done it. 🙂 Or someone else has …
Regards,
Tim
Hi Tim,
I know that it’s been a popular type of exercise at universities to do these sort of studies. I never understood what they plan to accomplish with it. What outcome of this would possible contribute to practical results?
I don’t really have any interest in whether a certain trading methodology works on artificial data. I can’t see how that would further the business.
Reality has never been similar to Brownian generated data or Gaussian shaped returns. I’m not sure where the value is in running models on such data, or how conclusions from it could be used. In the end, it’s all back to the usual academic ‘victories’ about how if we assume a bunch of things we know not to be true, then some neat conclusion could be drawn.
Andreas
Hi Andreas,
Fair enough :-), many thanks for a valuable explanation. I would just like to add that I am not a researcher (at least not in finance) or associated with any university. 🙂
Regards,
Tim