Earlier this week I published a simple 12 month momentum model which shows surprisingly good performance. The rules used are so simple that many of you are probably doubting the results. Perhaps you want a closer demonstration? Let’s take a look at the details of this model and see if it really works.
First, let’s revisit the rules.
- Every Friday we check if yesterday’s closing price is above or below what it was exactly a year ago. If it’s higher than a year ago, we go long. If it’s lower than a year ago, we go short.
- Position sizes are volatility adjusted, using the common ATR method. In this case, set to target 5 basis points per day and instrument.
- Investment universe is 100 futures contracts, covering all asset classes. Currencies, equity indexes, interest rates and commodities are all well covered with similar weights to each sector.
Got it? Nothing else. We just check if current price is below or above the price a year ago. No stops. No indicators. No magical numerology or mystical wave counts.
By itself, with just this logic, the model shows a compound annual return of 22% and a maximum drawdown of 26%. That’s before cost, but still quite ok. This model keeps positions open for quite a long time, so perhaps it would make sense to rebalance the risk once in a while. If we balance too often, that would raise trading costs and operational hassle, but if we rebalance too seldom we may end up with risk allocations that we hadn’t planned on. So let’s do a rebalance once a month.
When we rebalance, we just recalculate the position sizes based on the current volatility. Using the same simple ATR method, we see how many contract we should be having in the position, and correct any open position sizes.
After adding this, we’re now seeing an annual return of 22% and a maximum drawdown of 22%. This is the return profile we have now:
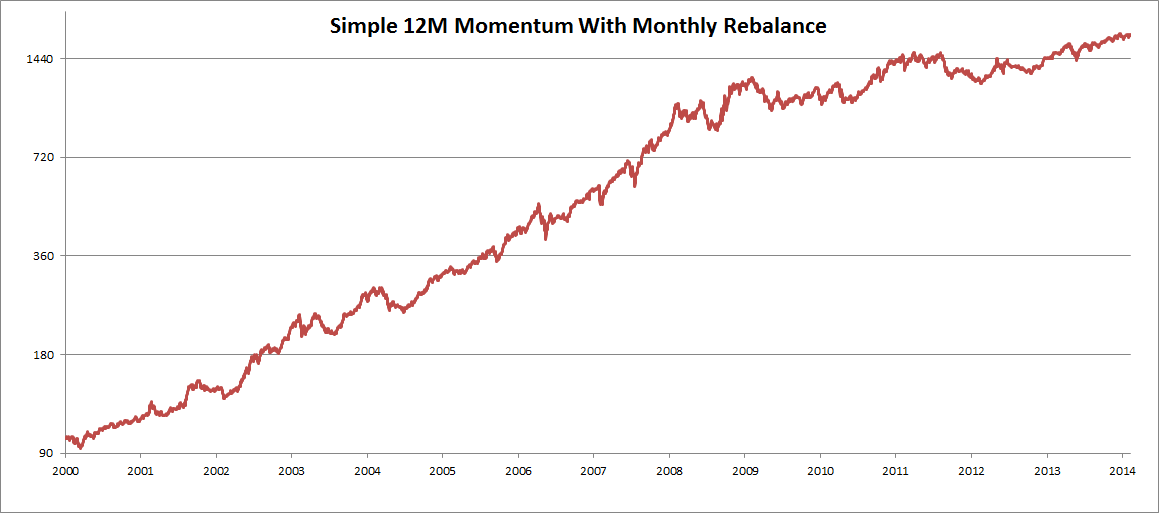
12 Months Momentum Model
This is in effect just a long term trend following model. One that actually did better than most other models in recent years. But can this work for single instruments? Or smaller portfolios?
Let’s try it on just one instrument first. How about the S&P 500 mini futures?
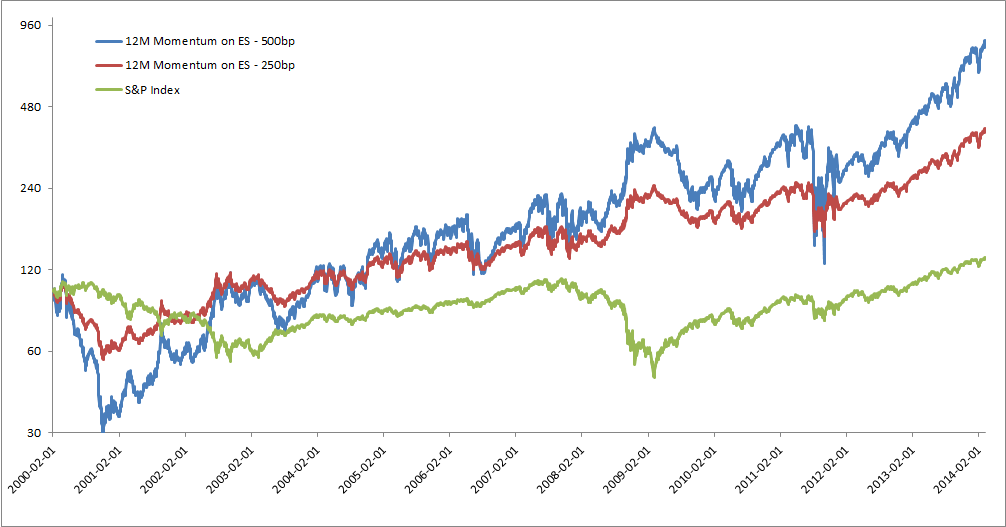
12 Months Momentum on ES futures
Yes, those are some scary looking drawdowns, and that’s why you should use diversified investment universes. But, it still shows pretty good results. The blue line uses a position sizing of 500bp, which may be on the aggressive side. Even with half the sizing, the index doesn’t stand a chance.
Let’s make a tiny portfolio of the same strategy and try it again. Just using the most common markets from each sector. We’ll try it on corn, cotton, Euro, Aussie, S&P, Nasdaq, oil, gold, Bund and US10. Just two from each sector. Not much diversification there.
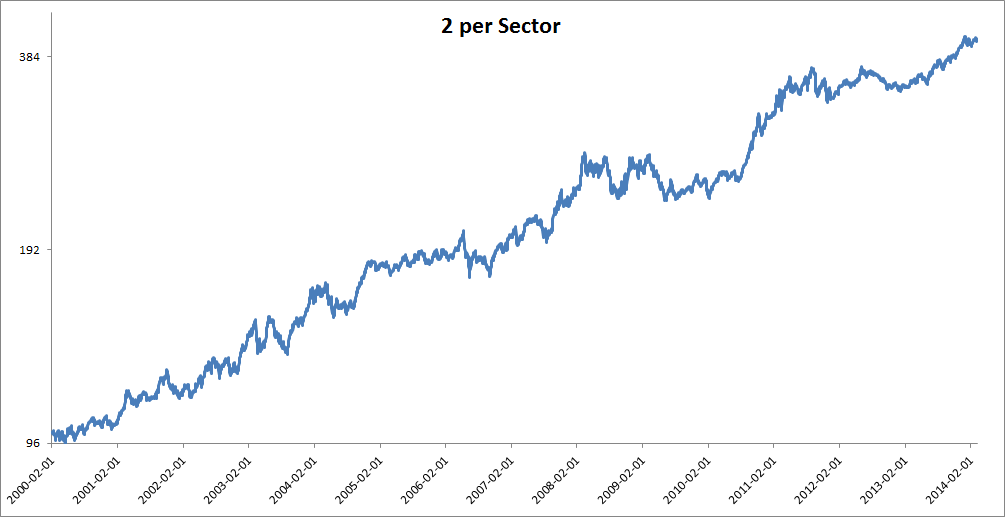
12 Months Momentum on 2 x 5 Markets
And the concept still works. Of course, we still have a little more volatility than you might want to see in a CTA fund, but that’s to be expected with such a narrow portfolio. Still, even this iteration is substantially better than buy-and-hold equities.
The point with this exercise is to demonstrate the importance of the concept. The exact method matter much less than the concept. In this case, we’re looking for trends. Simply checking if the price is higher or lower than a year ago gets that job done. Are there better ways than this model? Sure. Would it make a huge difference? No, but a little bit.
Do I seriously suggest that you trade this model? No, not really. You can easily improve upon this model. But perhaps this demonstration will refocus your efforts from indicators and details to looking at the bigger picture.
So what’s the problem with this model? First, it’s scary. It’s a long term model without stops and with very unpredictable risk. That makes it tough to run in a fund or institutional mandate. Of course, you’d have a tough time raising institutional money anyhow with such seemingly dumb model. Second, this model eats up a lot of margin. It has many positions on at any given time and uses much more margin than slightly more sophisticated models.
Would this model benefit from treating the short side differently or from adding volatility targeting? Probably. Fire up your compiler and try it out.


Thanks, I will use this model as a starter to do some research and compare with. I don’t find the model as scary as looking at this chart of backadjusted SP500: http://s30.postimg.org/qupnaeq29/SP500_Backadjusted.png That said, if you allow me, I have a dumb question: what do you mean by “volatility targeting”?
Perhaps this adds to the discussion: http://www.pyramis.com/fileadmin/templates/pyramis_public/downloads/us/TL_AA_Target-Volatility-to-Help-Smooth_Pyramis-US.pdf
Vola targeting is increasingly popular for CTA funds. It’s simple in concept but can be a little tricky in the details. The idea is that you set a yearly volatility target, and stick to it. This involves comparing realized portfolio volatility to target vola and rebalancing position sizes with regular intervals, as well as whenever the portfolio composition changes.
Big institutional investors like knowing the vola in advance and these methods can make your strategy more marketable to them. Of course, they won’t invest with you anyhow if you don’t have 3-5 years track record, 50 millions under management, and about a hundred other hurdles to overcome.
For smaller accounts, vola targeting doesn’t make much sense and it’s near impossible to implement on them anyhow.
Thanks – I suspect that many of these PMs would NOT do vola targetting if they were managing their own money. Take Arabica Coffee as a recent example. When you first bought that initial breakout in early Feb, say your position sizing rules made you buy 10 contracts. Now with expansion in ATR, vola targetting would tell you to get rid of some of those contracts. Effective partial profit taking. This would reduce vola in the month end NAV reports. When trading own money, not client money, there is less need to hide from vola that is in your favour – upside and downside vola are different things, but “the industry” treats high std. dev as “bad” because it messes up Sharpe Ratio.
Another very important point I see in the charts is that the diversified portfolio has approximately 3,75 times as much the performance of the small, 2 X 5 markets portfolio. As I see it, it sort of “proves” that the average and/or small investor would truly have competitive advantage only if he had access to a truly diversified trading strategy, even after performance fees of, say, 20% and maintenance fees of 2%. To my mind, this is a very important point, which should be clear to everyone in the trading world.
For the large portfolio, most of the gain is prior to 2008. Was there a structural change impacting this type of strategy and is it possible to adapt?
The whole industry had a tough time after that, for several reasons. 2008 was an amazing year where we all had massive profits when everyone else was losing big. So far so good.
After 2008, two main factors caused a bit of problem. First, interest rates are at near zero levels. In the past you could get a significant contribution to your bottom line simply by placing excess capital in money market and treasury instruments. That’s all gone now. There were also very solid trends in bonds/treasuries for the past few decades. Yields kept going down, price kept going up. At near zero yield, that game’s over too.
The second factor is the short term, single factor markets we had. Whether it was imminent Greek default, US debt ceiling votes, tapering or Italian fiscal problems, there was always this single minded, short term focus. Government meddling and focus on single news days created a new type of markets, without lasting trends. In the past year, this problem seems to have been going away and we’re returning to trending patterns again.
The yield problem is likely something we just have to learn to live with. It’s something that classic trend models are not built for, and they probably need to be adapted for it.
Thanks for the detailed response. For factor 1, yields, backtesting can be performed on real returns (by subtracting the risk free rate) and/or without bonds to estimate performance going forward.
Factor 2, availability of trends is essential for trend following.
The model also relies on uncorrelated assets to smooth the returns (factor 3?). Perhaps correlations have increased since the crisis? It may be possible to select more uncorrelated assets, for example, in equities “value” and “momentum” funds could be used (see related literature by Asness etc.)
Thanks for great implications.(sincerely)
and I am more interested in position sizing.
you said we can use 50 day ATR for postion sizing, and I wonder if it doesn’t depend on Total Capital Size?
for example, Today’s price of Gold is around 1330 pt. ATR(50) is 18 pt. Margin is 80 pt.
and then how many contracts do we need? 🙂 (If needed, let’s assume that we have 1000 pt, which means $10,000)
Example:
We’re buying gold.
Portfolio value is 1,000,000 USD.
Current ATR50 is 18.
Gold has a PV of 100.
We’re targeting a daily impact of 20 basis points.
Target daily move: (10M * 0.2%) = 2,000
Contract expected move: (18 * 100) = 1,800
Contracts to trade: 2,000 / 1,800 = 1.11
=> Round down and trade a one single contract.
The lack of granularity is of course a huge problem for smaller portfolios.
Hi Andreas, what position sizing did you use for 2 per sector strategy? Thanks
I can’t really remember anymore… It was the same basic sizing formula as before, but how many basis points is a different matter. Anyhow, it doesn’t really matter. You can tweak that up or down and you’ll mostly just change the y-axis scale.
Yeah, does not matter of course, I was just asking because I was trying to replicate it myself and see if I got everything right. Managed it for the S&P mini futures one (though funny enough it is highly sensitive to which day of the week we observe) and now wanted to see if I can replicate the 10 futures universe strategy as well.