Yes, I confess. I wrote that title to mess with search engines. As it turns out, the most popular page on this site, by far, is this one. It’s particularly curious for me, since I keep making the point that trading system rules are overrated. I’ve never come across anyone selling trading rules who actually knows anything about trading. And yet people pay thousands of dollars for such rules.
I’ve been approach sometimes by skeptics who don’t believe that trend following trading systems rules can be as simple as I claim in my book and on this site. They are right. The rules can in fact be even simpler.
Let’s try this: Construct a trend following trading system with the simplest possible rules. How many lines of code can you boil it down to? No, you still have too many rules.
The simplest system you’ve ever seen
Here are the rules for this system.
- If the current price is higher than the price one year ago, go long.
- If the current price is lower than one year ago, go short.
I ran this system on a broad set of diversified futures markets, covering all asset classes. But a system so simple cannot possibly work, right? It doesn’t even have any technical indicators. Well, judge for yourself.
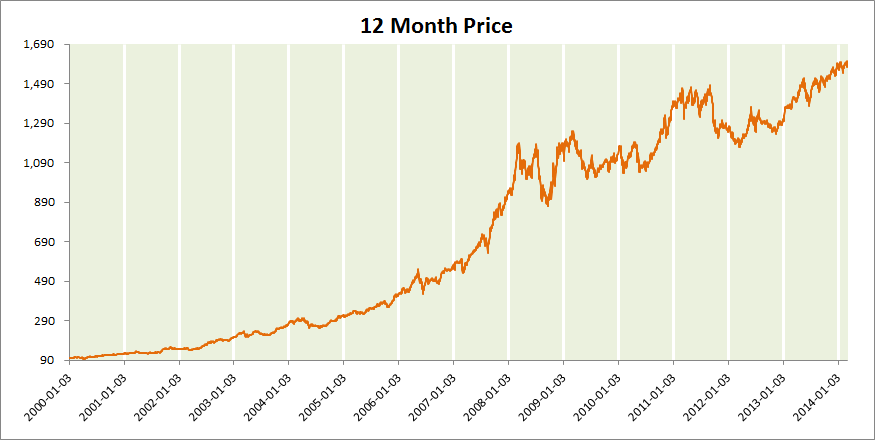
12 Month Price System
To make it a little easier to read, I’ll show the yearly results below as well. The green bars show the returns and the red bars the maximum intra-year drawdown.
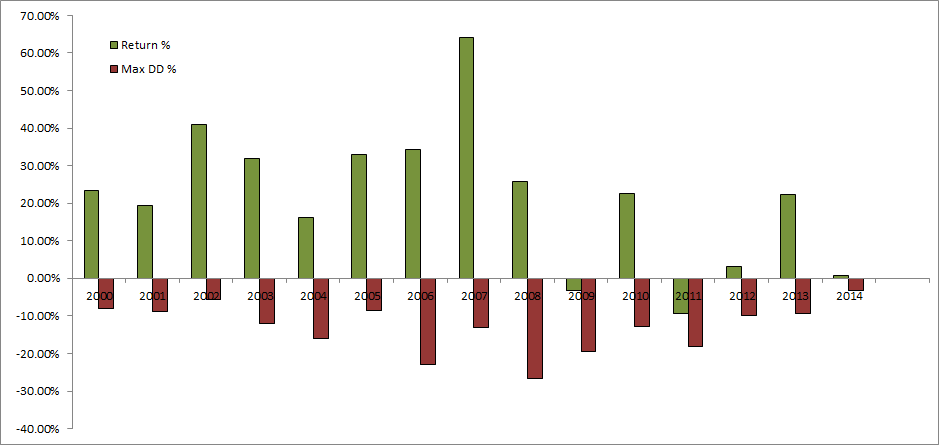
Results by Year
This simple strategy showed annualized return of 22% against a max drawdown of 26% and a Sharpe ratio of 1.1. This is before fees, so you’ll need to shave a bit on that, but it’s still better than most do in real life. Against that backdrop, do you really want to spend more time investigating the merits of exponential moving average versus simple moving average, RSI versus MACD, Bollinger Bands versus Keltner channels etc?
These rules shown here are of course not perfect. They weren’t meant to be. They’re just a demonstration how just how simple trend following can get, and still work. The rules do make for an interesting starting point though. They don’t need to be modified all that much to become quite interesting as a real trading strategy.
What matters are broad concepts. Get the concepts right, and it will be simple to construct rules around them. Most hobby traders fail because they are obsessed with some secret black box rules that would solve all of their problems. This is a myth created by people who wants to sell useless trading systems at high prices. If you really want to understand trading, you need to move beyond these myths.
Some trading strategies can get a bit complex, but rarely for the reasons that people outside the industry would expect. Practical issues are often a cause of complexity for instance. Rebalancing, portfolio constraints, risk management etc. can add complexity.


Great post very simple, I am looking forward to opening a futures account and trading in the near future although my capital will be small what are your suggestions on a portfolio on an account that has 25,000
Thx Andreas for your work,
Reminds me about this great paper, “Does Trend-Following Work on Stocks?”, by Wilcox and Crittenden, 2005
In the end, as Curtis Faith says, “Rules that you can’t or won’t follow will not do you any good.”
Funny you should mentioned trend following on stocks. I just wrote a piece for Active Trader Magazine on that subject. The gist of it is that while classic trend following models will crash and burn on stocks, the rules can easily be tweaked to do quite well. Expectations will need to be different of course. Stocks are different in many ways and ignoring that is a bad idea. I’ll write up some articles on that subject when I have time…
When is the article in Active Trader coming out?
I just submitted it, so it probably takes a couple of months. I’ll write up some shorter pieces on the same subject here on the site soon too.
Andreas, just to clarify, this simple system has no stops? So it is always in the market – once you get a long signal you stay long until you get a short signal to reverse the position.
No stops. The system rules looks so stupid that few would take it seriously. Still, it shows pretty interesting performance.
It’s a stop-and-reverse, based on current close vs close 250 trading days ago. I used ATR position size of 5bp and a universe of about 100 futures markets.
>>>Against that backdrop, do you really want to spend more time investigating the merits of exponential moving average versus simple moving average, RSI versus MACD, Bollinger Bands versus Keltner channels etc?
Yes, I do… just to make sure I was not seeing a mirage. 😀 Because I believe only the simplest give us a better picture of what trend following or trading systems are all about. The key takeaways for me are 0.05% per position in 100 futures markets. It doesn’t mean that investing time investigating the merits of exponential moving averages, MAMA or Stochasticization and Fisherization of technical indicators will do the trick for smaller portfolios. :)))
Very interesting.
I’d like to know the sector attribution of that P&L.
You have a point, Itamar. This strategy with a universe of 100 markets is not realistic for smaller portfolios. And by smaller, I mean less than a few millions. But… this model actual works quite well on smaller number of contracts as well.
I’ll do another post this week on this model, using lower number of markets and making it more accessible for smaller sized accounts.
>>>I’ll do another post this week on this model, using lower number of markets and making it more accessible for smaller sized accounts.
Thanks. Your research is very much appreciated. One of my current tenets is that if ETN or ETFs giving access to truly diversified trend following strategies (say, with 100 futures or so) and sound risk management (I mean managed futures), would give the small/retail trader the competitive advantage he needs, even after fees. Hence I hope this will be a new development in the industry. I could be with you. 🙂
Minor typo: where one reads “I could be with you”, I meant “It could be you”.
…you had me worried there. 🙂
Never mind… No way… 😀
Maybe I am misunderstanding something (quite likely), but I don’t know how this system could work. At the top of the market, you would by definition be long, and at the bottom you would be short. And any point in an uptrend would likely correspond to a point in a downtrend and vice versa, so that only the degree of symmatry would dictate whether you buy or sell. Set me straight, please.
The concept is based on the assumption that long term trends tend to last for over a year. You would indeed be long at the top and short at the bottom, but most of the time you’d just be long in a bull market or short in a bear market.
The markets don’t turn that often. Most of the time they just keep on ticking in the same direction with some noise around it. This model completely ignores that noise.
Try it out. It’s dead simple to model and back test.
a model like this would certainly benefit with a simple filter like requiring the 52-week ROC to be above, say, 5% to go long or below -5% to go short.
This would filter some false starts of new trends. Also a buffer zone at 0% could be created so the system could go FLAT
e.g.
LONG if 52-week ROC > 5% (or any value you may like)
EXIT LONG if 52-week ROC < 0%
to make the model smarter one could use a dynamic threshold rather than a fixed one (5% in our case).
Andreas like % ATR so we could use 50-day % ATR (ATR 50-day / Close *100) above a certain level.
The variations are endless. Usually the application of a ROC is better than the classic SMA xover for the DELAY in the reversal. In my personal experience, drawdowns as smaller using ROCs rather that SMA xover with similar time horizon.
RR
If the current price today is equal to the price 1 year ago, it is mathematically the same as the 1 year MA changing direction (turning up/down, having an inclination of zero). In other words, if the 1 year MA is turning up, go long. If it is turning down, go short. All a matter of perspective, i suppose. Thanks for an interesting article. I just bought your book, looking forward to reading it.
Thanks for buying the book, Jon! Yes, you’re logic is of course correct. The drop off effect will make sure that the SMA delta goes red if current price is below that of a year ago. Drop one price, add another, check the difference. But there’s no need to bother all those days in between with the MA though. You could do a rate of change for a year, for instance. Or just check for C250>C0.
Either way, it’s quite simply to model this and test it. I just sent out my C# code for this trading system to the subscribers of the Futures Intelligence Report.
Thanks for your reply.
Andreas, great post. Just finished your book a couple of months ago, and loved it. Quick question. Are there CTAs out there that cater to the $100K AUM market which focus on simple, rules-based, diversified asset class trend following that have a track record of at least a decade? For those who seek simplicity but still don’t want to do it themselves(realizing the work involved is still hard and it may make sense to pay a professional to do). I spend my days trading technical stock systems with daily frequency and this is definitely a different skill set. Thanks.
Thanks, Tom. Most large funds don’t accept $100k investments. Some have special tranches for retail clients with higher fees though. There’s also the possibility of UCITS structures, which are rising in popularity on my side of the Pond. This below for instance,
http://longchamp-am.com/en/products/ms-qti-ucits-fund/quest-tracker-index-program (Dear Mr. Regulator, this is not a public recommendation or solicitation, merely an example provided in response to a question…)
run by Quest’s Nigol Koulajian. You can see his track record here: http://www.followingthetrend.com/fund/?fund=AlphaQuest%20Original
Another favorite of mine, Fort (http://www.followingthetrend.com/fund/?fund=Fort%20Diversified) are also about to start a UCITS where you can enter with lower capital.
Thanks Andreas, very helpful. One additional question: does Lynx Program from Lynx Asset Management fit in within those same broad style parameters as thes as the managers you just described? Thanks again.
Tom C
Lynx has shown strong performance over the years. I’m not sure what vehicles they have with lower initial investment, but given their size they probably have something. They’re one of the larger players.
Hi Andreas
I read you book a month ago and have found it very interesting and illuminating. I am an investment amateur mainly out of intellectual curiosity. From my readings I came to believe that financial markets are inherently unpredictable but still have memory, so volatility tends to cluster and thus a kind of trend following strategy may have success.
In your book and your articles you show that how the trend is captured (entry rules) and how you exit the market is not so important. What is the pillar of your succesful strategy then?, is it, in a nutshell, diversification?. Have you written an article on that already?
If the markets trend, I tend to think that entry and exit rules should be important, but your examples look very convincing.
My point is that there are not that many different ways to capture trends. The concept is more important than the details. Most retail traders are tricked by system salesmen, mentors and other scam artists that the entry and exit rules are what matters. Mostly because this is something easy to sell.
The portfolio level dynamics is where professionals focus their attention. Not so much on the position level. Diversification and portfolio level risk/vola management is important. The idea of finding the perfect rules to trade a single market is an illusion sold to retail by people who never were a part of the business in the first place.
There are strategy types where exact entry and exit rules are pretty important, but trend following is not one of them. Try making a standard trend model on a diversified set of markets. Then add a randomizer, to randomly take trade signals +/- a few days from where your signal actually was. You’ll likely find that over time, it really didn’t matter.
What do you mean by portfolio level dynamics?. Return/risk global profile?. I would like to go more in depth into the matter. Any reading you may recommend?
I would like to understand the ultimate drivers, from a theoretical point of view, of course. I am not looking for the magic recipe as there is none.
You should be concerned about portfolio results, not position results. There’s not much helpful books written on that subject, but plenty of interesting research reports. Read a lot of research reports, and learn to filter what can be of use. The portfolio thinking is the single most important differentiator between retail and professionals.
When I find time I’ll see if I can make a collection of good research papers and either host them here or link to them.
Great!. Many thanks.
There is another version of this, which is followed by old timers in indian markets. If the price is above the closing of Dec 31st ( Indian markets are open on that day) then long , otherwise short.
Hello Andreas Clenow,
You mentioned many are selling trend following rules for a lot of money and I have no way of knowing who is legit or not. But I tend to agree with you: most are quacks. My question to you is will I learn as much or more from your book, ” Following The Trend” than I would buying Michael Covel’s course for $2000 to $3000 dollars? That seems like a lot of money to spend on blind faith. Your honest opinion would be highly appreciated. Sincerely, Matt Covington
Matt Covington…
I bought Covel’s product. He just teaches the Turtle system. The rules are available on the web for free. Clenow’s book is a much, much better investment in my opinion. I wouldn’t spend the money for the Covel product but highly recommend Clenow’s book.
Chris, I appreciate you taking the time to respond to my email. I feel your reply is completely honest and that means a lot to me. Good luck in the future in your trading endeavors and happy Fourth Of July. Sincerely, Matt Covington
Hi Matt,
I don’t really want to comment on any individual system seller. In my experience, I’ve never come across a system seller who actually knows anything about trading. It’s a very shady business. The very premise behind system selling is the illusion that there are perfect systems that can make you rich.
I try to explain ideas, concepts and methodology we use in the business. This is an evolving business and to stay alive you need to do constant research and adapt. If you want to enter the systematic trading field, you need knowledge and understanding. The basics look simple, but it’s a pretty complex business when you get into the details.
The systems I’ve seen marketed to retail traders are based on very old, well known ideas. Some of them worked at some point, some never worked. As a system seller, you don’t really have to care though. It’s not like you have investors and a daily NAV calculated by an independent party…
I show a system in my book, but it’s in no way meant to be a perfect trading system. It’s designed to be a learning tool, a way to explain what trend following systems are about. It’s quite easy to improve upon the system I show, and I encourage anyone to do go ahead and do that.
Dear Mr. Clenow,
I want to thank you also for taking the time to respond. It is not often the author of a book either bothers to respond or has the time to do so. It means a lot that you did.
Thank you kindly, Matt Covington
Hello Mr. Clenow,
First of all thank you for sharing your methods and your ideas.
You say no stops, but I can’t stop thinking about what happened with the Swiss Franc in the middle of January 2015… Actually I blew up a 3000€ demo account because I was long (with no stop) in the USD/CHF (and my risk only was 2% of my account)…
How can we avoid these market behaviours without setting stops? Please advise.
Thank you very much in advance!!
This particular trading model has no stops and it did quite well during the January FX turbulence. Some approaches require stops, others don’t. Long term models usually suffers from having stop loss logic.
The point of the trading model in this article is to show how extreme simplicity actually works really well. It’s really easy to program. Test it, run a simulation for a few decades back and see. Of course, it’s not possible to trade with a 3k account, or even a 300k account.
I think that Andreas said it very clearly in his book – diversification and a proper position sizing! No stop would rescue you from the “SNBomb” aka EUR/CHF peg disaster. Most CTAs I know lost less than 5%. Some even 1%. I lost 7.5% on that event with Andreas’ aggresive system in his book. Is 7.5% of your capital unbearable? Then risk a half and your lost would be 3.75%.
Not many traders realize that risk/profit factor are linear. There is no such thing like super low risk and super high profit! But something between.
Hello Andreas,
Thanks for replying to my questions. I was wondering about Position Sizing, how do you manage a position if, lets say the position gets rich, and you want to increase your exposure. Do you use a Fixed Ratio Position Sizing with a Delta, to increase your position or you book yr profit and re enter the trade? I am a bit confused by the notion of risk per trade when you are increasing your position when its getting rich. Do you have some ideas about it? I have also another question do you apply a more qualitative risk management when it comes to a portfolio. Lets say you have more than 10 lines in your portfolio, say on a global level your portfolio loses 2 %, do you liquidate a percentage on all the contracts you own, to reduce the risk, and if it loses even more, you liquidate the portfolio completely. Because even if its highly unlikely that all your stops will be triggered, how do you deal when you are losing a significant amount on portfolio level?
Thank you very much
Dave
Hi Dave,
The concept of risk is probably the most misunderstood in the retail trading community. Unfortunately, a lot of people who don’t really know much about finance have written lots of trading books, where they just make up their own definition of risk as they go along. Much of these made up terms have unfortunately made their way into simulation platforms, further confusing people.
Frankly, I have no idea what a “Fixed Ratio Position Sizing with a Delta” is. Certainly not anything you’d see in the hedge fund space. I did a quick google search, and it seems like yet another gambling idea that has no relation to professional finance. It looks like another variation of pyramiding, which makes absolutely zero sense. Increasing risk because you had a profit in the past is dumb. Your past profits or losses have no impact on directional probabilities going forward, so there’s no reason that should be an input factor.
I’m not going to dig deeper into the concept of risk, as that would be quite a long (and boring) discussion. My general advise is to read real finance books about risk to get the general concept. Briefly, risk is very closely related to volatility. You look at factor such as historical volatility, covariance, stress testing etc.
In the case of this article, I used a simplified view of risk based only on historical volatility. We make an assumption that a market will have a similar volatility in the next month as it had in the past month. That assumption won’t hold up of course, but hopefully it will be close enough to use as an approximation.
Based on this assumption, we target each position to have a certain daily average impact on the portfolio, in this case I believe I used 10 basis points. Since vola isn’t stationary and this is a long term approach, we need to rebalance regularly to maintain the same risk level.
Forget about all these so called “money management techniques”. This is mostly nonsense made up by people who lack any real experience of the business, pretending to be self made trading gazillionaires and writing books about their own misunderstood terms. Most of what you see in such books is just gambling terminology.
Thank you very much Andreas for taking some time to write a long comment. I have both of the your books, the new one and following . I am only interested in the institutional space. I believe that risk is extremely important in trading, i definitely believe you become a risk manager the second you enter a trade and sometimes even before. I do understand the techniques I mentioned are derived versions of gambling concepts. But you are totally right, there is no relevance with the delta notion if we believe markets are random or the markets are efficient.
If i get you well, the notions risk must be related to vol, covariance/correlation, sizing, stresstesting and Value at Risk for bigger structures.
Do you have a book to recommend when it comes to risk the way you see it?
Thank you very much again
D
Hello Andreas,
Hope you are well.
I have some questions for you when it comes to automated trading and portfolio construction.
Say you have an AUM of 5m, I guess you run your strategy on more than 30 markets and pick the signals you get right? I am a bit confused on the sectors you choose, because if you allow the system to pick any sector it sees a signal you can end with a portfolio concentration on some core markets no? With this, you are not achieving diversification. Or you try to discretionarily pick sectors to counterbalance any concentration? Or do you ‘cherry pick’ all the signals you get to form a portfolio? Or you take any signals till your assets/exposure allow you.
Thank you a lot
Dave
Portfolio concentration is what CTAs have always made money from. Yes, diversification is good to a point, but you need to allow for concentration at times.
The demo model in this article however always holds a position in all markets. It’s either long or short every asset. Then again, this is an unrealistic demo model designed to make a point.
Hello Andreas,
Thank you. It’s very impressive.
I would like to check your results. Could you provide your futures list?
Regards
Umit
Hello Andreas, this post helped to reaffirm the notion among trend followers that simplicity trumps complexity. I am myself trying to develop simple trend following systems. But could u help direct me to back testing systems. Preferably cheap but effective back testing solution. I would like to know what software you used or recommend a good software.
Thanks in Advance
Salman
Hi Salman,
I prefer RightEdge.
http://www.followingthetrend.com/2014/05/why-i-prefer-rightedge-for-strategy-modeling/
Hi Andreas,
Thanks for all the cool stuff on your blog!
I’m running simulations in RightEdge and would like to plot strategy trades on charts and I cannot find an obvious way of how to do it. Attaching the debugger from VS is very insightful at times, but having a visual feedback on a chart for quick checking weather the conditions were coded right (crossovers etc) is much more simple. I couldn’t find anything on the topic at RE forums. Any hints?
Thanks you.
Sincerely,
Hi Vitaly,
Very easy, unless I’m misunderstanding what you want to do.
Just add whatever indicators and stuff you like, and then open the chart from the simulation results, under the Symbol Results tab. There you can see everything, the entry and exit points, all indicators (Unless you set ShowInChart property to false). You can add your own lines, text etc in the code.
You can even automatically save chart images to disk if you like, which is what I do for this site.
But I’m not sure if I understood correctly… Let me know if it doesn’t solve the issue, Vitaly.
Andreas
Thanks Andreas! I’m begining to love those face-palm moments in development process 🙂 I’ve been clicking around for an hour in search of it, just to learn that it was sitting there staring in my face.
I’m glad it got sorted, Vitaly.
Sometimes it’s easy to overlook the obvious. Some 15-20 years ago when I was managing a quant team, all of which were strong programmers, two of my guys were busy discussing how to make a variable negative if it’s positive, and vice versa. I overheard and chipped in with a rather complex solution. And then another of the quants turns around and said “What are you freaking stupid? Multiply by minus one!”
We all just exchanged a brief look of embarrassment before going for early beer…
Hi Andreas –
Using your formula for z-score (inv vola-avg vola/std dev*inv vola), I’m getting some off-the-wall numbers that do not accord with the kinds of numbers that appear in the z-score column in your example. When I use the regular formula, z = (X – μ) / σ, the numbers are more aligned. (How does that sound from someone who’s not taken stats?)
What do you think of using implied volatility numbers (from options chain) in place of inverse volatility?
Thank you.
Ken – OGP
I think I was a bit unclear in how I expressed the formula, professor. I do use the regular formula for z scores, based on inverse volas.
So your formula z = (X – μ) / σ is absolutely correct, where X is observation inverse vola, μ is the average inverse vola and σ the standard deviation of the inverse vola.
Using implied vola numbers should be fine, assuming you can source the data for it. Seems a little overly complicated to me, but the result should work just fine. You’d still need to inverse it of course.