Diversification can be a funny thing. It’s one of those things that sound so boring and mainstream that many people simply ignore them. Just something boring that the establishment wants us to do but really has no actual use. Kind of like taxes and seat belts.
But diversification can actually be of use. It’s especially important for trend following strategies where the return distribution over time for any individual market can have very fat tails.
I’m going to do a quick demo to show just how important the diversification can be. Let’s use the same simple 12 months momentum model that we used twice before. I put together a diverse universe of round 75 instruments, fairly evenly split on the five broad sectors. These sectors being agricultural commodities, equities, currencies, non-agricultural commodities and rates.
This model, as you might remember, only looks at whether the current price is higher or lower than a year ago. It goes long if the current price is higher than a year ago and short if it’s lower. That simple. We ignore everything in between. The demo here would work just as well with any other kind of trend following model as well.
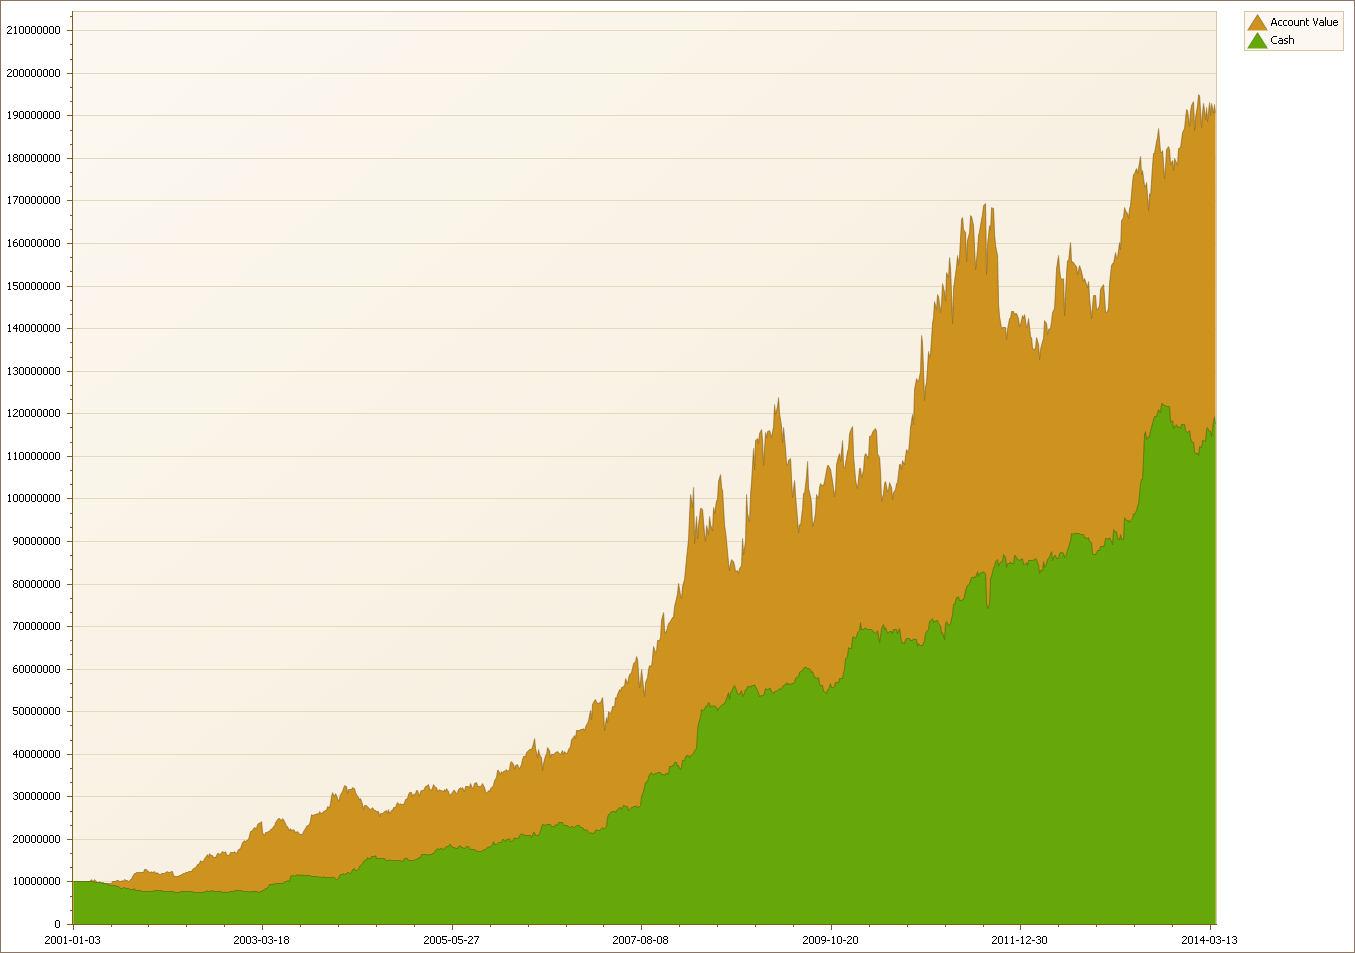
Position sizes are equal risk sized, using a simple ATR based approach. Below I’ll show the results first for running this model on all markets at the same time, like most would do in reality. The model will trade all 75 markets across all asset classes all the time. The risk allocation per market is set to 10 basis points, using the classic ATR formula [(0.001 * AccountValue) / (ATR50 * PointValue * fxRate )].
Here are the results for the whole set.
- Annualized Return: 25%
- Max Drawdown: 27%
Now what would happen if we run this same simulation on each sector, one at a time? To get a fair comparison we’ll have to crank up the position sizes to match the same portfolio risk. The alternative would be to leave sizes the same, but since we have much fewer instruments we’d naturally end up with very low numbers. If we want to compare these investment universes as alternative strategies, they should be given the same portfolio risk allocation. We have five sectors with about equal amount of markets, so I’ll just round things off a bit and set position sizes to 50 points, five times the risk per market.
Here are the results.
- Agricultural – Annualized Return: 14.5%, Max Drawdown: -66.2%
- Equities – Annualized Return: 22.5%, Max Drawdown: -65.2%
- Currencies – Annualized Return: 12.4%, Max Drawdown: -46.8%
- Non-Agricultural – Annualized Return: 21.5%, Max Drawdown: -56.2%
- Rates – Annualized Return: 26.9%, Max Drawdown: -57.6%
None of these look very appealing. They all show good profits, but at far too high risk.
Take a look at the chart below, showing the performance for each individual sector when traded by itself, as well as a fat black line showing the performance for the diversified portfolio.
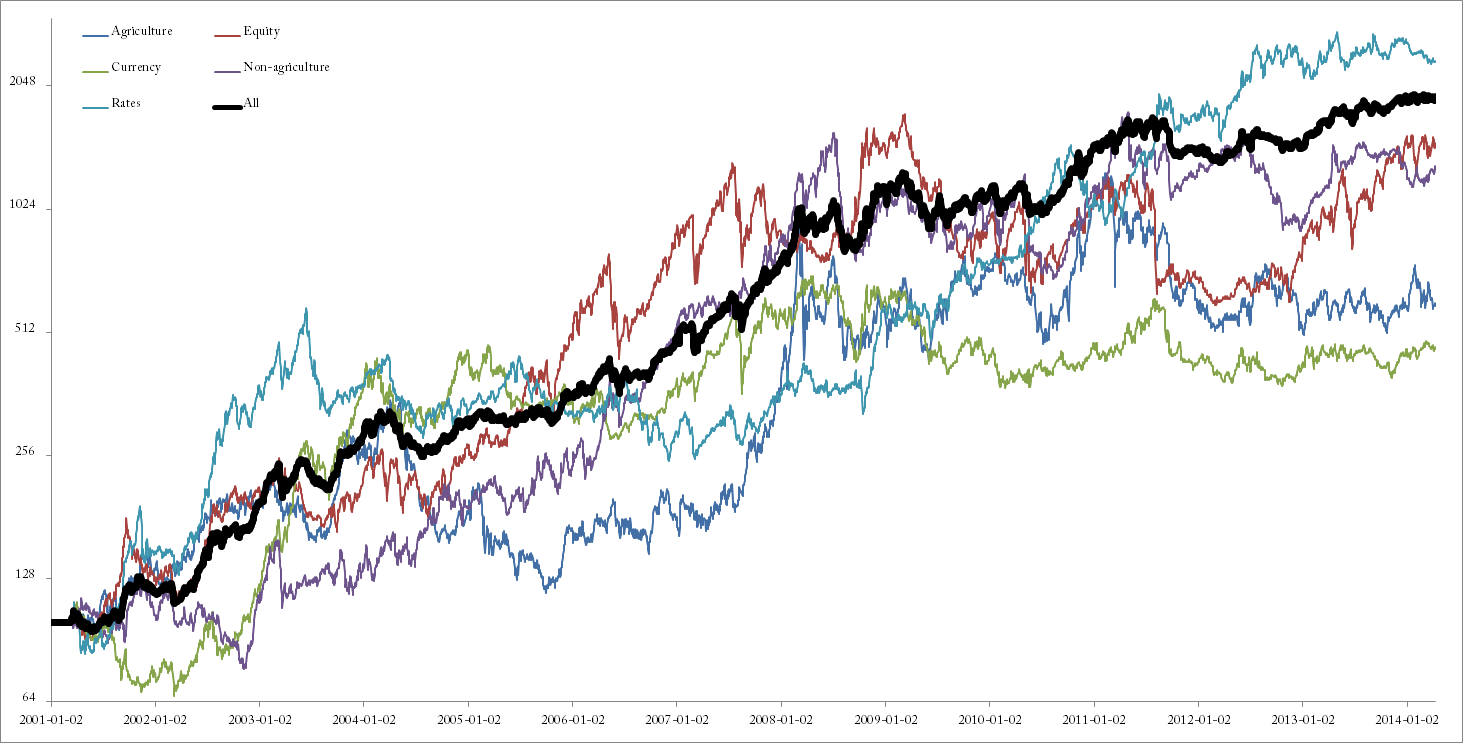
Now you might point out that the rates sector had higher performance by itself, but would you really want to have that almost 60% drawdown from 2003, with six years recovery time?
The agriculture had an incredible run from a bottom in early 2006 and the returns two years after that were really spectacular. But then they had a sharp pullback again.
The point is that the markets is like a box of chocolate. You never know what you’re gonna get. This is why you need to follow a diverse set of markets.
For smaller portfolios, sub million dollar, it can be difficult to trade as many markets as I used here. Difficult being a bit of an understatement of course. If you’re outside of the US, you can try CFDs, but they’re banned stateside.
That opens for an interesting question: What’s the minimum number of markets you would need to get decent diversification in a trend following model? Well, let me get back to you that one another time…
On the topic of multiple markets… Did I mention that I’m now making my internal weekly futures research report available for public subscription? This is a buy-side research report, with none of the fluff that’s the hallmark of sell side letters. I do this report at my asset management shop to make sure everyone’s always aware of what’s going on across all futures markets that we trade. If you trade futures, perhaps this can help you and give you an insight into how futures hedge funds approach the global markets.
Sign up for a free month trial here.


>>>Difficult being a bit of an understatement of course. If you’re outside of the US, you can try CFDs, but they’re banned stateside.
Even if CFDs and spread betting are considered, the “funding charges” on nominal contract values cannot be underestimated either: http://tradersplace.net/forum/thread/237/what-about-cfds/view_3163/ and http://s28.postimg.org/9fpknw4d9/Brent_Crude_Oil.jpg That’s something that I intend to “try” to investiage the overal impact on performance.
>>>Did I mention that I’m now making my internal weekly futures research report available for public subscription?
I would suggest to put a banner, make it more visible or something on your frontpage: http://www.followingthetrend.com/
Andreas, what are your thoughts on using ETF’s instead of futures in the case of smaller portfolios?
ETFs can be good, but there are a few downsides.
First, never ever trust the name of an ETF. Study the prospectus of the ETF, as well as the actual price curve in detail. Many ETFs are good, some are outright scams.
Second, ETFs are cash instruments requiring full or near full funding. That means that you lose the leverage potential in futures, and it will relegate you to volatile issues only. Trading ETFs on bonds gets pointless, as it would just eat up your cash without giving you any theoretical possibility of meaningful returns.
Third, the coverage might not be as wide as you’d like. It’s been a while since I looked into ETFs in detail, but I doubt that there are good ETFs in orange juice, lean hogs, soybean meal etc.
I don’t say that it’s not possible to use trend following on ETFs. Just that it’s different. You can’t have the same expectations and you have to adapt your approach a bit.
I think CFDs make a better alternative for a small portfolio. They are of course banned in the US, for reasons I can’t claim to fully understand.
Andreas,
What would you suggest for sub-million account in the US?
Hard to say. I really lack experience with smaller accounts.
Equity strategies are generally easier for smaller accounts. That asset class works a bit different than futures of course and you’d have to adapt your models to that.
You could trade futures with very, very high risk. That’s ok for some of course. But most diversified futures models will have a high risk of blowing up smaller accounts. Then again, they’ll also have a high probability of very large returns. Not my style of trading, but it works for some.
What is striking here is the CAGR and Max DD figures are superior to the “standard” model from the book.
CAGR 25% Max DD 27% versus CAGR 26% Max DD 29%.
Hi,
In your book, you splice up the trades on a yearly basis, further subdividing them into their respective sectors (rates, agri, non-agri, equity, currency). You also state the fact that for the sake of simplicity, correlation effects are left “out of the equation” and you put a remark that the risk, i.e. 2008 was considered very high due to the high internal correlation of assets/trades back then.
Is there an approach how to quantify correlation in a portfolio, to be used in a backtest (rejecting trades, vary position sizing, etc.) in order to control correlation risk and minimize portfolio volatility?
The search for crisis alpha in that sense would suggest trading off a comparatively large portion of profits vs. reducing internal correlation.
Varadi has written a nice paper, it fits nicely, appears to be a good read, some graphs are a bit out of proportion though.
Thanks.
http://cssanalytics.com/doc/MCA%20Paper.pdf
This is where things get really complex. The question is really whether or not this type of complexity is justified or not.
You could do a manual correlation analysis and apply some sort of common sense logic. You would just reduce sizes where you find corner risks that don’t appear healthy. That’s an easier solution.
Arriving at a solid math solution that automatically scales or caps risks to certain factors is very difficult. You also have to balance the fact that much of the strong trend following returns comes from taking corner risks. If you start capping this off, you might also cap your upside.
Hi Andreas,
Have you covered your below question in another article?
“What’s the minimum number of markets you would need to get decent diversification in a trend following model?”
I would say it probably depends on your strategy average reward-to-risk ratio and trade winning percentage. With some binomial probability distribution calculations based on number of instruments to arrive at the final figure.
Would be nice to know your thoughts on this!
Best regards,
Ishwar.