Is trend following dead in the water? Has the concept stopped working? Are we seeing the death of the CTA industry and a return to traditional investments? Fair questions. Let’s look closer before answering them.
The industry is certainly going through a very tough period. This is the second bad year in a row and the cumulative drawdowns are adding up to quite large numbers. John Henry, an old school industry legend, just folded and closed shop. Several smaller houses are doing the same. We all know that this has not been easy times for trend followers. The intelligent question to ask is whether this current situation has happened before or if this is a new and surprising development.
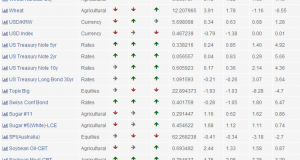
Start by looking at the current state of trend following. The table below shows a large number of trend following futures funds. It shows their October returns, where all but one had a negative month. It shows the year to date return for each fund where you’ll find the average in the double digits negative. Lastly the table shows the current draw down. The current drawdown tells you how much the fund has lost since its highest peak. The marker next to this shows if this is the all time maximum drawdown. You’ll find that over half of the trend following funds saw their deepest losses ever in the past month.
| Name | October | 2012 YTD | Current DD | Max DD |
|---|---|---|---|---|
| Abraham Trading Company Diversified Program | -2.9% | -5.5% | -14.5% | |
| Adamah Capital LLC Diversified Program | N/A | -10.6% | -20.7% | Max DD |
| AIMhedge Management Ltd AIMhedge GDF Classic EUR Institutional | -4.0% | -8.2% | -19.1% | |
| Altradis Capital AG AlphAlgo | -6.9% | -20.9% | -28.2% | Max DD |
| Amati Global Investors Ltd Systematic Trend Fund | -3.1% | -14.1% | -18.3% | Max DD |
| Atlantic Pacific Trading Group Enhanced Turtle Trader 25 | -6.7% | -23.3% | -46.8% | Max DD |
| Blackwater Capital Management Global Program | N/A | -14.1% | -24.9% | Max DD |
| Campbell Company Global Diversified Large | -8.3% | -2.2% | -18.7% | |
| Chesapeake Capital Diversified | -5.4% | -15.7% | -35.1% | Max DD |
| Clarke Capital Management Worldwide | -5.5% | 17.5% | -15.2% | |
| Drury Capital Diversified Trend Following Program | -4.2% | -6.1% | -28.3% | |
| DUNN Capital Management DUNN Combined Fund DCF | -6.6% | -30.9% | -43.6% | |
| Eckhardt Trading Company Standard Plus | -9.1% | 3.4% | -22.3% | |
| Eclipse Capital Management Global Monetary | -5.2% | 2.3% | -13.4% | |
| Estlander Partners Alpha Trend | -7.0% | -6.5% | -21.9% | Max DD |
| FORT LP Fort Global Diversified | -3.4% | 4.5% | -5.5% | |
| Hyman Beck and Company Global Portfolio | -2.2% | -22.5% | -32.3% | Max DD |
| IKOS IKOS Futures Fund | -1.1% | -6.7% | -13.3% | Max DD |
| Incline Investment Management LLC The Tahoe Strategy | -4.6% | -17.0% | -38.0% | |
| ISAM ISAM Systematic Fund Class A USD | -4.8% | -16.5% | -23.0% | Max DD |
| James River Capital Corp James River Navigator Futures Fund LLC Class 2X | N/A | -23.7% | -48.4% | Max DD |
| John Locke Investments Cyril Systematic Program | -5.0% | -6.1% | -15.0% | |
| John W Henry Company Global Analytics Program | Closed | -21.1% | -38.3% | Max DD |
| Kaiser Trading Group Kaiser Trading Group | -1.0% | 0.5% | -6.4% | |
| M S Capital Management Global Diversified Program | -4.9% | -16.0% | -33.0% | Max DD |
| Millburn Corporation Diversified Program | -2.0% | -8.1% | -17.7% | |
| Mulvaney Capital Management The Mulvaney Global Markets Fund Ltd | -15.1% | -33.6% | -44.5% | |
| NuWave Investment Management LLC Combined Futures Portfolio Ltd | 0.2% | -13.9% | -16.8% | Max DD |
| Qbasis Fund Management Qbasis Futures Fund A | -8.1% | -17.7% | -44.1% | |
| Quality Capital Management Global Diversified Programme | -10.9% | -3.6% | -26.5% | Max DD |
| Quantica Capital AG Quantica Managed Futures | -2.9% | -4.5% | -6.9% | Max DD |
| Quicksilver Trading Diversified Program | -1.6% | -31.9% | -38.1% | |
| Rabar Market Research Diversified Program | -7.2% | -5.1% | -23.2% | Max DD |
| Robinson Langley Capital Management LLC Managed Account Program | -12.8% | -23.5% | -40.8% | |
| Sunrise Capital Partners Sunrise Capital Diversified Ltd | -8.5% | -23.2% | -27.3% | Max DD |
| Superfund Group Superfund Green L P Series A | -3.8% | -10.7% | -40.0% | Max DD |
| Transtrend B V Transtrend Diversified Trend Program Standard Risk USD | -2.4% | 0.4% | -6.8% | Max DD |
| Welton Investment Corp GDP Program | -4.0% | -6.8% | -23.9% | |
| Winton Capital Management Diversified | -2.6% | -3.0% | -4.7% | Max DD |
Bear in mind that most of these funds represent the very best in the business. Not just in the trend following business but in the hedge fund business. The drawdowns we are seeing now are not a function of the skills of these managers. As painful as it is when it happens, these drawdowns are the cost of doing business in this field. Even after these very large drawdowns, the compound return of most of these funds is far higher than what you would have gotten on traditional investments, such as buy and hold equities. And the max drawdown on equities is historically larger as well.
So what happened this year? What’s going wrong?
There is one general factor and one more specific. The general factor is the lack of larger scale global trends. For the past two years the market has been in a so called risk on/risk off mode. The correlations between different asset classes have been high and single factors such as political decisions have been causing swift turns in many markets at the same time. This in itself is a negative factor but nothing new for the business. These periods come around every few years and they will come around again.
The more specific reason for the poor returns is a rather new phenomenon. The big engine of trend following for several decades have been the rates sector. Yields have been going down year after year, decade after decade. This in turn means that rates prices move up in prolonged periods of time. We are now in a near zero yield environment and that is creating a very new problem for trend followers.
Most traditional trending models do not take into account the possibility of a near zero yield situation. So when bond prices now move up, the traditional models start buying. They are of course unaware of the highly asymmetric risk that is at the heart of any long bond position on these levels. The upside is effectively capped. Naturally there can still be gains based on roll yield, as we have seen in Japan. It is however much more limited than the potential downside.
As yields approach zero, the price moves in the bonds get smaller and smaller. This in turn tells traditional models to take on larger and larger position sizes. These models attempt to target a certain potential portfolio impact per position. They are normally not aware of the asymmetric risk either. This means that leverages increase as traditional models take on larger and larger bets on long bonds.
This year we have seen a very choppy behavior in most bond markets. We see strong breakouts, where many trend followers start buying big. Then there are sharp downwards reactions, where many trend followers take their stops. That game can add up to large losses very fast.
Should we be worried?
We should always be worried. If you don’t worry about anything, you’re not thinking hard enough. The current worry is how long this draw down period will last, which if any strategy modifications are needed and how to keep and raise capital in this harsh environment.
But. Don’t forget the obvious positive conclusion of the current situation. The futures industry is right now in the same situation as the equity markets in late 2008. It is in the largest drawdown in recent memory. That is the safest and historically the most profitable time to invest. The futures business, much like the equity markets, have seen many troubling periods. Each one of them seemed like the end of the world at the time. Much to everyone’s surprise, the sun still rose the day after.
There is no reason to believe this time will be different.
There are lessons to be had from this period of course. The first is to make sure you do not take on excessive risk. It is very tempting to gear up your futures models and go for the really juicy returns. If you are lucky, you’ll be the big hero. If a period like this comes along, you’re likely going out of business. The second lesson is to look at large structural changes which may impact the core premise of any part of your models. The ultra low yield situation comes to mind here.
Most important of all. Diversify. Two years ago you would have concluded that financial futures were the key to success and in particular on the long side. Had you then ‘optimized’ your models to gear up that part and reduce or remove the rest, you would now be in a world of hurt. Trade everything. And then some. Trade all asset classes. Trade multiple models. Trade multiple strategies. It’s a lot of hard work to do this, but it will pay off over time.
My book, Following the Trend, is scheduled to be released early next week. Both the hardcover and the Kindle will be out in a matter of days. Amazon still offers a large initial discount. Pick up your copy here.

Following the Trend – Now available on Amazon