 Is it risky to be 150% leveraged? How about 1500%? It’s the wrong question to ask. Leverage and risk are not necessarily connected.
A common argument against trend following hedge funds is that they are too leveraged. This is based on a lack of understanding of leverage. Most people who bring up this argument are just used to one asset class. Equities.
Even if you only deal in equities using notional leverage as a risk gauge is just plain lazy. Unless you deal in perfectly identical instruments it just makes no sense to add up their face values. If you at least deal in cash instruments it will tell you how much money you need to fund your position. For futures the number would be meaningless.
Am I just saying this to justify the fact that a normal managed futures strategy could be 1,000 to 2,000 percent leveraged at times? Perhaps. But that doesn’t make me wrong.
If you hold 100 dollars worth of IBM and buy another 100 dollars worth of IBM shares you double your risk. But if you hold 100 dollars of IBM shares and buy 100 bucks counter value of Microsoft your risk impact is more complex. Let’s say you have a portfolio of only two stocks. One is a utility company and one is a biotech. The utility company tens to move up or down by less than a percent any given day. The biotech company usually moves 4-5% in a day and sometimes as much as ten percent. If you want to get equal risk exposure to both stocks you would of course need to buy a lot more of the utility. Else the biotech issue will completely dominate your PnL. Even if you only deal in stocks you need to stop thinking in terms of notional values and start thinking in terms of volatility. And this is still while staying in the most basic of asset classes.
Now take that thought over to the futures world. Is it more risky to hold a million bucks worth of gold or a million bucks of Eurodollar? How about a million gold and ten million Eurodollar? These comparisons should show that it is pointless to talk about notional amounts in such a context. In the futures space you will see extreme difference in volatility across different types of markets.
This table shows actual positions held by one of my standard trend models on May 21, 2009. Why this date? No reason. Any date will do just fine. Each position was sized according to its volatility level. In theory each position should therefore have an equal daily impact on the portfolio as a whole. There is no reason to take an excess risk in Silver just because it has larger price swings than the Euroswiss. Each trade is created equal and should have the same chance to make a difference.
| Position | Sector | Notional Exposure Percent |
|---|---|---|
| Australian Dollar | Currencies | 7.79% |
| Canadian Bankers' Acceptance | Rates | 147.07% |
| Canadian Dollar | Currencies | 12.08% |
| Cotton | Agricultural | 2.55% |
| Euro | Currencies | 13.83% |
| Eurodollar 3M | Rates | 151.57% |
| Euribor 3M | Rates | 226.76% |
| Euroswiss 3M | Rates | 276.71% |
| Short Sterling 3M | Rates | 157.07% |
| Hang Seng China Enterprises | Equities | 3.62% |
| Hang Seng | Equities | 4.03% |
| Nasdaq 100 | Equities | 5.24% |
| New Zealand Dollar | Currencies | 7.62% |
| Gasoline | Non-Agricultural | 5.49% |
| Soybeans | Agricultural | 5.22% |
| Sugar | Agricultural | 4.20% |
| Swiss Franc | Currencies | 11.71% |
| Silver | Non-Agricultural | 4.49% |
| US 2Y Note | Rates | 58.91% |
The effect of volatility adjusting positions is that the notional exposures get tilted to the short interest rates. Tilted is a euphemism here. Some may point out that the short rates crush everything else into little rounding errors. Did you notice the Euroswiss exposure of nearly 300%? Yep. Not a typo. If this worries you more than having four percent in the Hang Seng than you just didn’t do the math yet.
Why is the short rates dominating? The short answer is that they just don’t move much. A 0.25% move in a single day in a three month rates future is a really large move. The longer answer would involve telling you about the difference between the left and the right side of the yield curve and explaining how duration impacts interest rate sensitivity. While this is very much basic finance and useful to understand, it is not required to be able to handle diversified futures strategies. Just measure each instrument’s normal daily price moves and adjust your position size accordingly.
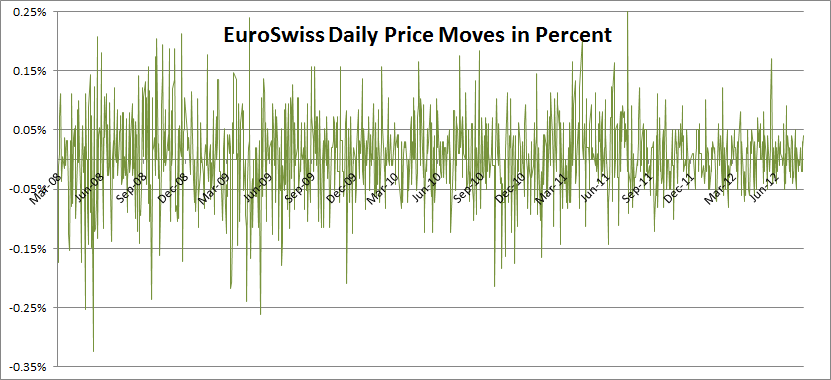
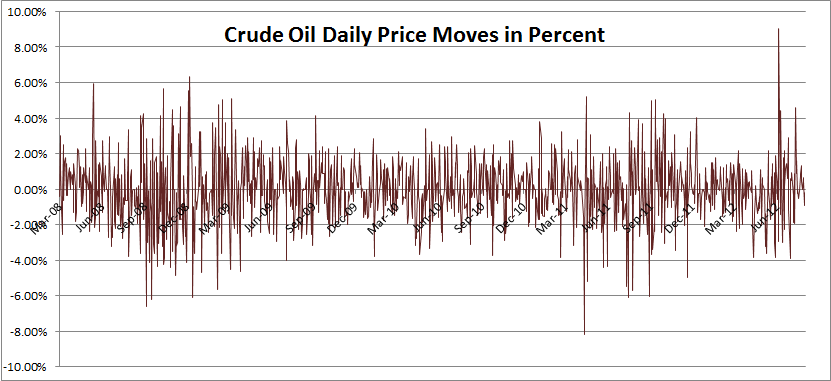
If you’re still not convinced, compare the scales on the two charts above. They each show daily price variations for the same time period. The first one for the three months Euroswiss and the second for crude oil. How would your actual risk allocation look if you simply bought one million bucks of each?
Did you add up the notional exposure? Yes, it really does end up at around 1,100%. But by now you should hopefully agree that this is a nonsense number anyhow. The position sizing for this portfolio was done using a basic ATR method, aiming for approximately 20 basis points daily impact per position on average. The core assumption here is that future volatility will resemble past volatility. We all know this will break down in reality of course but it’s still close enough approximation. You could do a more fancy VaR based position sizing and you’ll end up with very similar weights. With the same caveats about stationary volatility of course.
Since each position is sized equally, the number of positions is much more important than their notional weights. This is just an indication of risk level. To get a more accurate risk overview you need to go into the gritty details. For one thing, you need to always be aware of the current state of world correlations. The correlation table approach will give you a good overview of how risky the world is at the moment and how risky your portfolio is in that context.
Risk is the most important part of trading. Monitoring and managing it is the key task of any professional trader. Never underestimate the importance of this. But summing up notional exposures? Nuts.
So what about the portfolio example here? How risky did it turn out to be in reality?
Significantly less risky than it was to hold 100% in a large equity index at the time.
 Following the Trend


