Beating the index isn’t really all that hard. I’m going to show you a great way to beat the market while having some fun in the process. This is a brand new way of managing portfolios, and I’m going to explain every detail of it. The True Alpha method is easy to trade and is unique in offering personalized vanity portfolios. There is a considerable amount of research behind this approach and now it’s being made available to the general public.
Yes, dear reader, this is one of my more frivolous posts. The previous paragraph is both true and not true at the same time. Don’t worry though. Even when I’m joking, I’m dead serious. Or if it’s the other way around. I forget. Still, you may actually end up learning something from this post.
The basis of my brand new True Alpha(tm) strategy is a concept I’ve proudly stolen from a brief post by Joel Dickson at Vanguard a couple of years ago. It’s really a bit of an odd article. At first, he brings up a valid problem, only to quickly dismiss it and fall back into a general marketing pitch. I like the first part of his post, and I’m going to pick that ball right up again.
Achieving True Alpha(tm)
True Alpha(tm) is a revolutionary portfolio construction algorithm, selecting stocks on the sole basis of the first letter in the stock ticker. What, what? Yes, yes, calm down and listen.
To show you that we’re not just messing around here, let’s throw some simulations at the wall and see what sticks. As a baseline universe, we’ll use the S&P 500 Index. The simulations take historical index membership into account of course, including the graveyard. If it didn’t, it would be kinda useless as a simulation, wouldn’t it. Dividends and the usual stuff is naturally handled properly as well. For now, we’ll allocate equal cash to all positions.
The portfolio is rebalanced monthly to ensure that we maintain approximate cash parity. If not, the weights would go seriously out of whack with time.
First we’ll try the obvious. Let’s run a simulation that buys only stocks starting with a certain letter. Have you ever considered what initial ticker letter is the most beneficial for long term price development? Why not? You probably considered what month is the best, or what weekday.
The answer is of course Y. If you had bought all the stocks starting with Y, you would have more than doubled the return of the S&P 500 for the past 15 years. Other good letters include B, H, P, T and W, all of which would have yielded double digit annualized returns since 2000. However, you should obviously stay away from Q and Z, where the annualized return for the same period was negative.
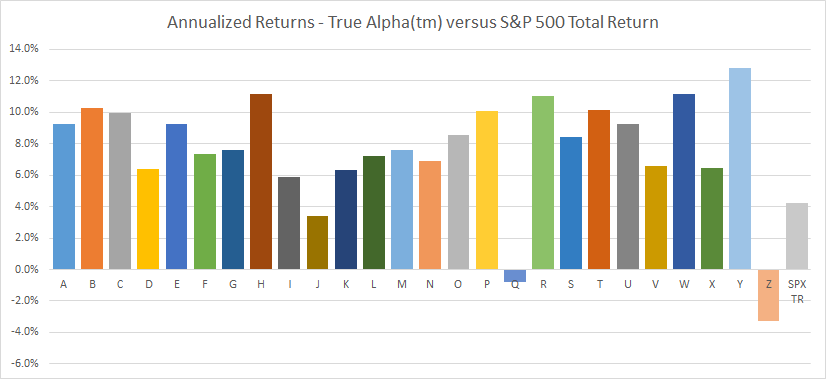
Only amateurs buy Z stocks!
The drawdowns are fairly evenly distributed, but again the Z stocks show their weakness. Clearly you should never buy stocks starting with Z.
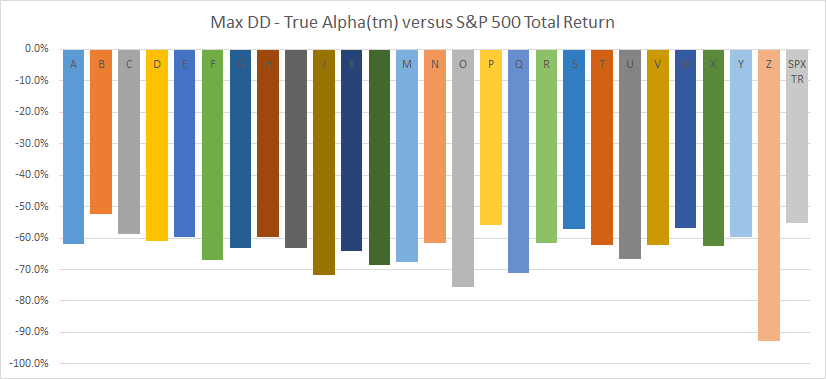
Z is for Zuckers!
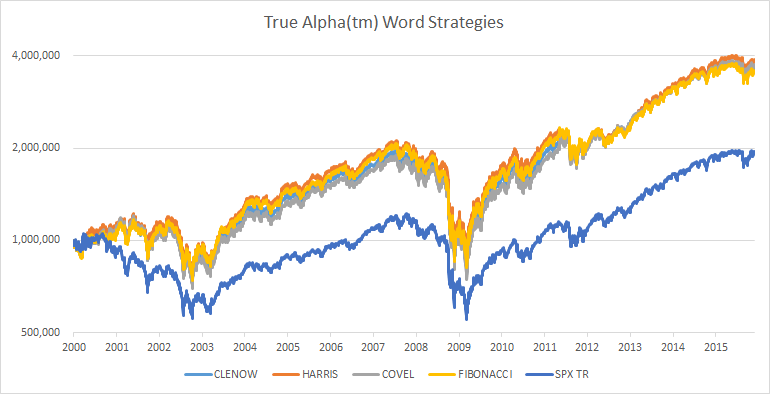
Still, you don’t really get a good feeling for long term price development without a proper time series chart. Below you see the S&P 500 total return index as a thick black line, and each individual True Alpha(tm) strategy separately. As you see, almost all of our new strategies showed significant outperformance.
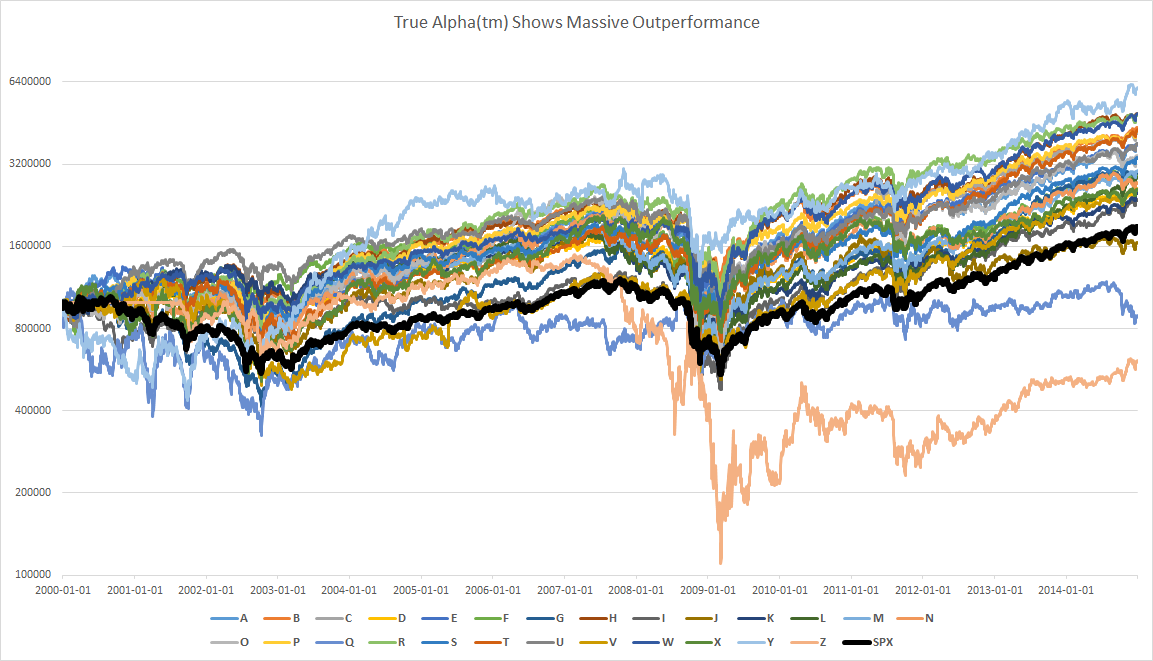
Are you convinced yet?
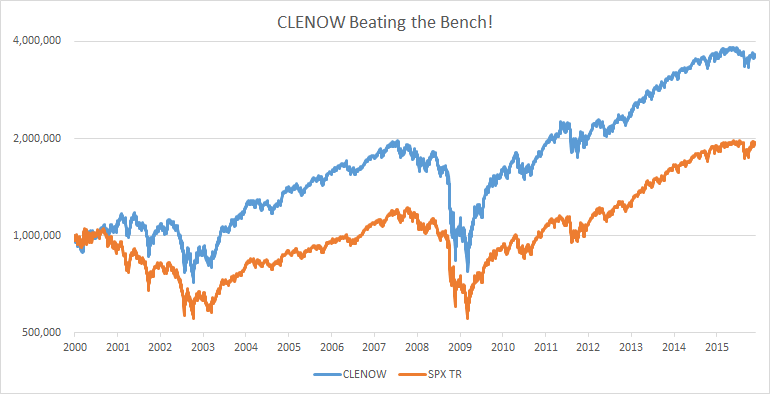
But, wait. It gets better! If we can do strategies on individual letters, why not on full words? What if we bought all the stocks starting with the letters in a particular word? Surely you must have already considered which word would be the best one. Well, let’s settle that once and for all.
Yeeaaah!
You’re probably curious about how the current CLENOW portfolio would be composed. I know I am. As it turns out, the CLENOW portfolio is highly diversified. All in all, there are about 130 stocks in the current portfolio. The sector allocation is spread nicely on all 10 sectors.
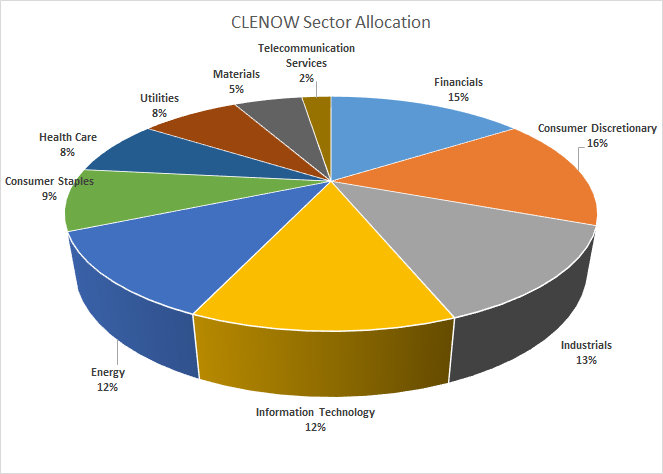
The CLENOW distribution
Come on, stop it! This is nonsense!
Ok, fine. I’m just having a bit of fun.
All the results presented above are real. The simulations are done properly. It’s not a trick. Well, the trick is in the interpretations and conclusions. The Vanguard article ended with simply dismissing the results as unrealistic backtests and examples of misleading investment approaches. I was a little disappointed that Joel didn’t touch on the reasons why we see these kind of results. There is after all a clear reason why we see outperformance by simply buying all G stocks or the amazing CLENOW(tm) strategy. I’m convinced that the author is well aware of the issue I’m getting at and he probably had good reasons not to go into the underlying problem.
The elephant in the room isn’t the superior stock picking model shown above. It’s the highly inferior weighting system of the S&P 500, and most other equity indexes. Market cap weighting is the issue.
Market cap weighting means that the top few stocks totally control the index. For the S&P 500, Apple has a weight of 3.7%. That’s about the same as if you combine the bottom 100 stocks in the same index. The top 10 stocks in the index, Apple, Microsoft, Exxon, GE, J&J, Amazon, Wells Fargo, Berkshire and JPM together have a weight of 16.5%. That’s similar to the weight of the bottom 300 stocks all together.
Market cap indexes are not diversified. We all pretend there are 500 stocks in there, but only a handful actually matter. To make things worse, the stocks that do matter are the largest companies in the world. How much more upside is there once you’ve got a company with a market cap equivalent of the GDP of Switzerland? Is it more likely that those giants will continue up, or that some other company will gain in value? Which has more possible upside?
The truth is that you can pick stocks at random and have a very high probability of outperforming the market. As long as you pick enough stocks to gain a decent diversification. Yes, I’ve done the research on that, and yes I will post an article on that soon too.
But what about the CLENOW portfolio?
As much as I would like to claim that the magic is in the stocks starting with the letters C, L, E, N, O and W, the reason why this works has a different explanation. There are enough stocks starting with those letters to gain sufficiently broad diversification. Buying those stocks will result in a broad participation in the overall market, and simply by not using market cap weightings we get instant outperformance. In the simulations above, I used cash parity for simplicity. You’ll see more or less the same (though slightly better) results with vola parity.
And the underperformance of Z stocks? Well, how many stocks start with Z? Not very many, is it. If you buy and hold only Z stocks, you’ll usually get a portfolio of 2-3 stocks. Therefore, the result will be pure luck. In this case, bad luck.
But still, I take pride in knowing that you will see a strong outperformance simply by purchasing stocks based on my name. Surely that means something. After all, it’s not like you can take any ridiculous word and come up with similar results.
Oh, fuck!


Hah! I really enjoyed that. Learned something at the same time. You need to create an online resource so we can all enter funny words and see how well they perform compared to the index. 🙂
Hey, wait a minute… Are you implying that Clenow is a funny word..?
Andreas,
I always enjoy your articles/posts – curious why it works – is it just randomness at work?
Also, who do you use/recommend for historical futures data? I am looking to do some back-testing and looking for some “clean” continuous contract data. Who has the best data? Do they even exist?
Thanks in advance and always enjoy your thoughts – your rant on the MTA was perfect!
More or less. Each of these combinations will result in large enough portfolios for the stock selection to be of less importance. You’ll get a broad portfolio of many stocks, which ones doesn’t matter that much. The cash parity weighting isn’t great, but it’s much better than market cap weighting, and there’s your outperformance.
Futures data: I’d recommend CSI Data, for three reasons. 1. It’s high quality data, 2. You’ll get a 15% discount if you give them coupon code ‘tradersplace’ and 3. If you use that coupon code, I get a kickback.
Andreas,
I’m interested in your opinion of the difference between momentum and trend.
Do you manage(allocate and rebalance) your portfolio in terms of momentum?
As a quant expert, do you keep track of momentum of several assets(equity, bond, commodity etc) for your portfolio?
In my view, there is subtle diffrence between trading and portfolio management
Equity traders and investors focus only on the stock market, but portfolio managers focus on the entire assets(Am I right?)
Thanks in advance and enjoy your thoughts,
Minjae
Andreas,
congrats for this post as well as the others before. I find your work on equity trading to be fantastic. Your book on stocks has opened a new window of trading opportunities. PLease, keep posting and writing!
Happy holidays,
J
Hi Andreas
Very interesting post.
There’s a similar jokey story in one of the Schwager Wizards books about someone who was a very successful investor. She was patriotic/militaristic and had no pretensions to understanding the stock market, so she simply bought all the big stocks with “America(n)” or “General” in their names.
I’m wondering whether the CLENOW portfolio would do better in risk-adjusted and/or absolute terms with the ATR-based equal volatility position sizing/rebalancing (“risk parity”) you discuss in Stocks on the Move, rather than the equal cash value sizing/rebalancing you’ve used in this simulation?
I’m partly wondering this because I’m puzzled by your discussion in Chapter 14 of Stocks on the Move. You get a better absolute return, and lower maximum drawdown, by simply using risk parity position-sizing than you do by using risk parity combined with momentum-system stock selection (comparing the two prior to the application of a trend-filter). I’m guessing you also get lower volatility because you’ll have a much higher proportion of stocks from defensive sectors. You nevertheless opt to stick with the momentum system, in part because holding all 500 stocks is impractical for most people. This makes me think (1) an ETF that owned/replicated the whole index with risk parity weighting should certainly be possible, and (2) in any case a sub-set such as the CLENOW subset could potentially be superior to the momentum subset while also being less unwieldy than the full set of 500 stocks.
In a sense applying a CLENOW screen might be psychologically harder in difficult times because it doesn’t “make sense” in the same way that a momentum screen does. But it might actually prove easier: you wouldn’t have to read lots of “Is this the end of CLENOW?” and “CLENOW underperforms vs. value” articles. You’d be separating the system from your ego-investments (especially if your name wasn’t Clenow) so the hard times the system went through would carry less of a sense of you being wrong personally in following it.
Finally: I know you’re being tongue-in-cheek when you say you should never buy a stock which begins with a “z”, but there could be something to it. The “q”s and the “z”s may have a propensity to be over-owned because they include a larger than normal proportion of glamour stocks. (The moral would be: don’t buy stocks called “Quantum Zap”, “Zoom Quadrillion” etc. as they’re strictly for suckers.)
Do you have a ranking system here. When you have a buy signal on more stocks than you can afford to buy, which one do you then buy?
No, no ranking needed. The model checks how many stocks there are to be bought and simply divides the cash between them. All selected stocks are bought.
Oh yes, i see it now! Thanks!
What about this article
http://www.followingthetrend.com/2014/03/beating-the-index-with-minimum-rules/
Here you buy until you run out of cash, do you rank here somehow?
This gets post of the year!
Good job…
Merry Christmas!
From what I understand, during the 15 year period tested, small-cap stocks greatly outperformed large-caps. Since large-caps are over-represented in the S&P index, this lead to the index under-performing an equally-weighted sample. Is that correct?
It would have been greatly helpful if you added one or two more lines, 1. would be an equal-weighted S&P 500 list, which I assume would look more ‘average’ relative to the individual letters. 2. would be a list of the “S&P 250” (I just made that up, it would be the smallest 250 companies).
I would guess, based on your data, that these extra plots would make the rest of the data look more reasonable. Right now, the gray S&P line doesn’t look like an average of anything. I would guess an equally weighted S&P line would be about an average height of the other lines, and the smallest 250 should show even greater returns? This would surely clarify things, if that is the case.
Could your whole article just be a function of the time period? If you picked a time when large cap stocks outperformed small-caps, this would probably be very different.
Class Article…All the best!