I was recently questioned about how the strategy I present in Following the Trend did in 2012. Those who read it may recall that the analysis ends as of December 2011. It should come as no surprise that last year was bad. 2012 spelled trouble for most trend followers and most CTA hedge funds set new all time max draw down levels. It was not the worst year the Core Strategy has seen, but it was the second worst. We’re already hearing the doomsday predictors talking about ‘The End Of Trend Following’. The same crowd were predicting the end of the stock markets after 2008.
First up, the numbers.
| Jan | Feb | Mar | Apr | May | Jun | Jul | Aug | Sep | Oct | Nov | Dec | Year | |
|---|---|---|---|---|---|---|---|---|---|---|---|---|---|
| 2012 | -2.6 | 1.7 | -2.8 | -3.8 | 6.9 | -10.1 | 8.5 | -3.8 | -4.6 | -5.9 | -2.7 | 3.6 | -15.9 |
16 percent down in a year is not a disaster, but as a second negative year in a row it does hurt. Let’s take a closer look at what happened here.
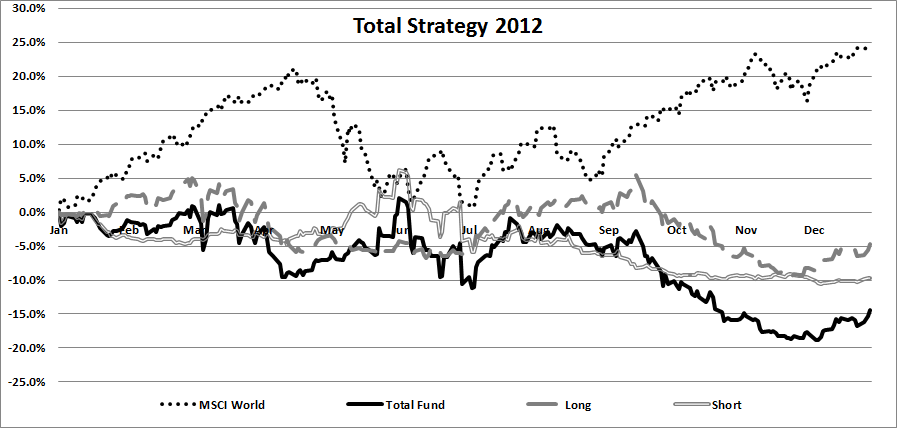
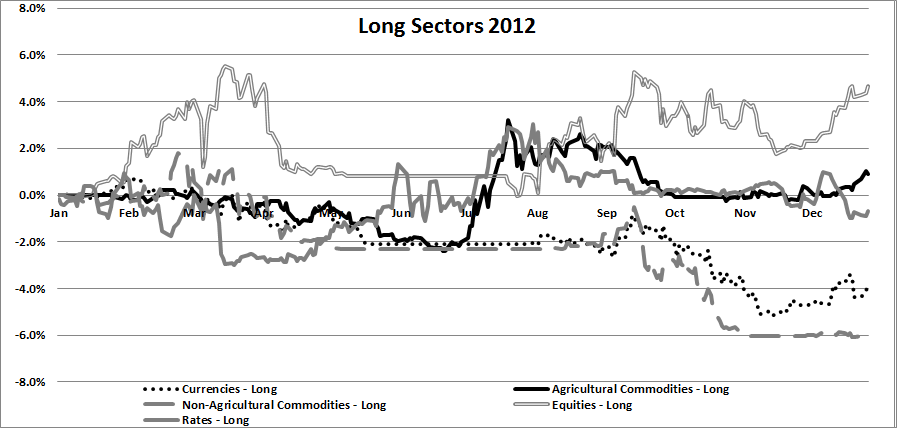
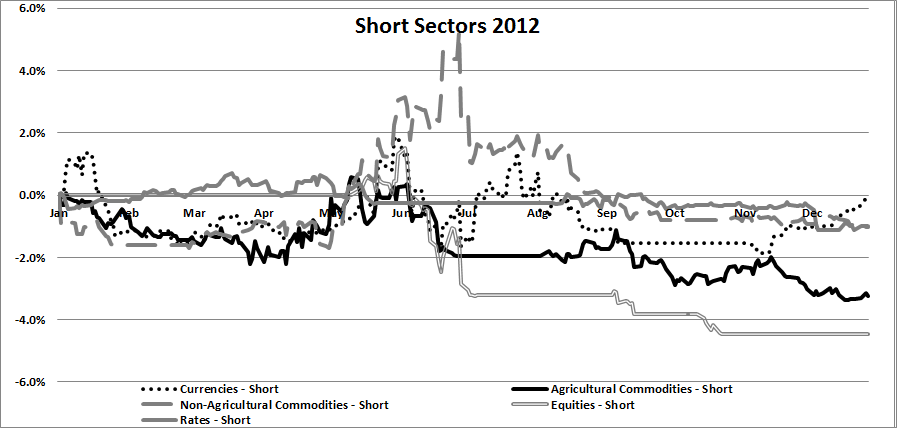
The first thing that may surprise is that while the world equity markets did quite well, trend followers didn’t profit from this. The explanation is simple. 2012 was driven by short term political decisions and surprises. It was a risk on / risk off situation most of the year with sharp turns up and down at the whim of nervous investors. When the whole market is focused on the same narrow problems, trend followers will suffer. Our approach is based on diversification. When the global financial markets, across all asset classes, are dominated by short term fear and euphoria, this breaks down. All asset classes tend to exhibit a greatly increased correlation. The result is that you end up holding a large number of positions, which essentially are the same.
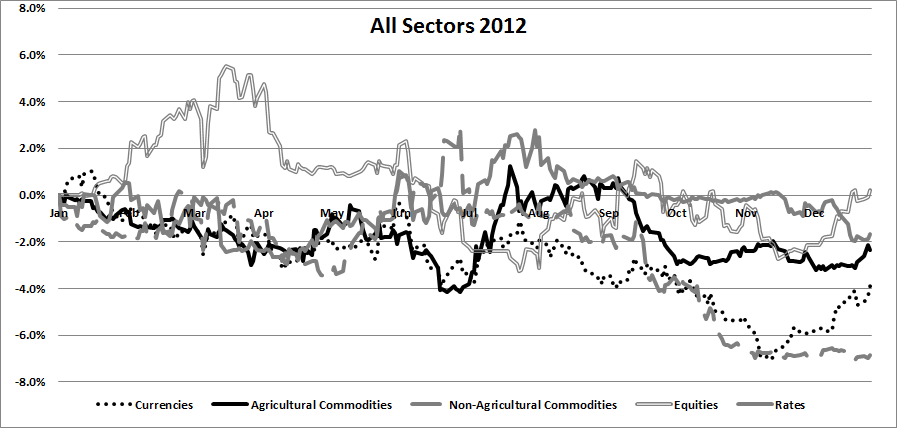
In a year where the MSCI World ended almost 25% up, our strategy only managed to make four percent from long equity indexes. During the summer there was a drought in the US and the grain prices shot up in short time. The strategy did gain from this but gave up half the profits in the remainder of the year. The non-agriculturals did very little throughout the year, but false entry signals during the Fall ended up contributing to the losses as well.
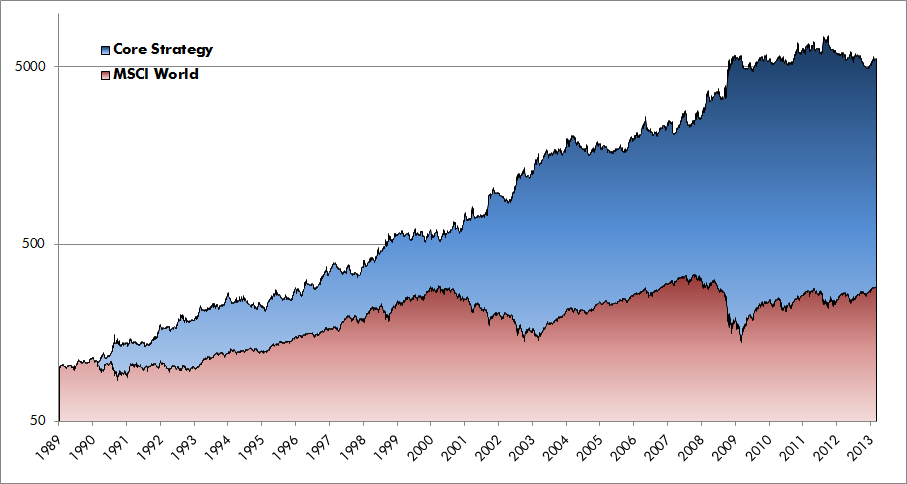
So after 2012, the Core Strategy stands near its all time max draw down. Does this mean the end? Did trends just cease to exist? Well, 2013 is certainly not an indication of this. So far, the same strategy is up over 8% on the year.
Let’s put this into perspective. The chart below shows the long term results of the Core Strategy vs MSCI World.