A good indicator is based on sound logic. It should try to quantify or visualize a concept that makes sense and is easily explainable. Mostly I use very simple indicators. The most basic of indicators can be very helpful if used rightly. The indicator I’m about to describe here is quite simple in concept but requires a few more steps than a moving average. If you’re familiar with the basics of trend following models, this indicator should make perfect sense to you.
The Plight of the Trend Followers

Turtle is not amused.
Most trend following positions end up losing money. This is not news to anyone who studied this field. The money is in the fat tails, the run-away success trades that make up for many small losing positions. Losing most of the time is simply the cost of doing business as a trend follower. But, what if you could exploit this phenomenon?
Think about how a classic trend following model works. Try to find weaknesses to exploit. Look for the points that cause pain to trend followers. That’s where you’ll find some opportunity.
Wait, what? Isn’t this site about trend following? Why are we talking about trend following kryptonite?
It’s very dangerous to lock yourself to one approach. If you start getting religious about trading methodology, you’ll get no where. Getting stuck in the trenches like Apple vs. Windows or technicals vs fundamentals is not only unprofessional, it’s outright dumb. Most approaches have valid elements and you can construct profitable trading strategies from many starting points, so why limit yourself to one approach?
There are still pure trend followers around, but they are becoming an endangered species. Sure, most of the returns in the 300 billion dollar CTA industry comes from trend following. It’s still the dominating strategy in this part of the hedge fund business. Most CTA funds however incorporate multiple systematic strategies, always looking for new alpha and models with low correlation to the existing portfolio.
So when do trend followers suffer? On sharp trend pullbacks of course. Whether that happens right after breakout or later in the trend, it’s these pullbacks that cause the problem. In particular when there’s a pullback far enough to trigger a stop loss and then turns back into the trending direction. This happens all the time and it’s highly frustrating.
But what if we could quantify and measure trend following pain? Perhaps we can find a way to enter trades just as many trend followers are forced out? Perhaps the exits of big CTA funds will cause the prices to be pressured further, making it likely for the price to rebound after?
Enter the Clenow Plunger

Beware of the plunges
Most trend following models are very similar. The source code and rule set might appear different, but they all tend to buy and sell around the same time. Those of you who bought my book know how such a system might look. You did book my book right..? Oh come, just buy it!
Let’s start with the trading model presented in my book and make an indicator to measure pain level. Quick recap: The model had a trend filter using 50/100 day EMA, entered on 50 day extremes and took stops at 3 ATR units against the trend. And that’s the one sentence summary of my 300 page book. Sorry for the spoiler.
The stop logic is key here. What if we made an indicator that measures how many ATR units we are from the recent peak? Yep, that’s exactly what The Clenow Plunger does.
What kind of a name is The Clenow Plunger for an indicator? Back off, it’s my indicator and I’ll name it whatever I want!
Ok, here’s the basic logic of the Plunger. The input numbers can of course be changed as you please.
- Check the trend filter, using a 50/100 EMA.
- Check the last 20 day extreme price, in the direction of the trend.
- Check current price.
- Calculate the difference between current price and 20 day trend extreme.
- Normalize this difference by dividing it by a 50 day ATR.
Now you’ve got an interesting indicator. When the reading is around 3, many medium term trend followers are exiting. If you do some simulations, you’ll also find that this is a pretty good entry point.
|
1 2 3 4 |
if (trend() ==1) _plunger.Current = (_top.Current - Close.Current) / _atr.Current; else _plunger.Current = (Close.Current - _bottom.Current) / _atr.Current; |
Trading the Clenow Plunger
The most obvious way to use the Plunger is for entries. No, I won’t give you complete trading rules. At least not in this post… This indicator can be used for entries into both counter trend and trend models, depending on how you want to handle your exit strategy.
Here’s how the indicator looks on a few different markets:
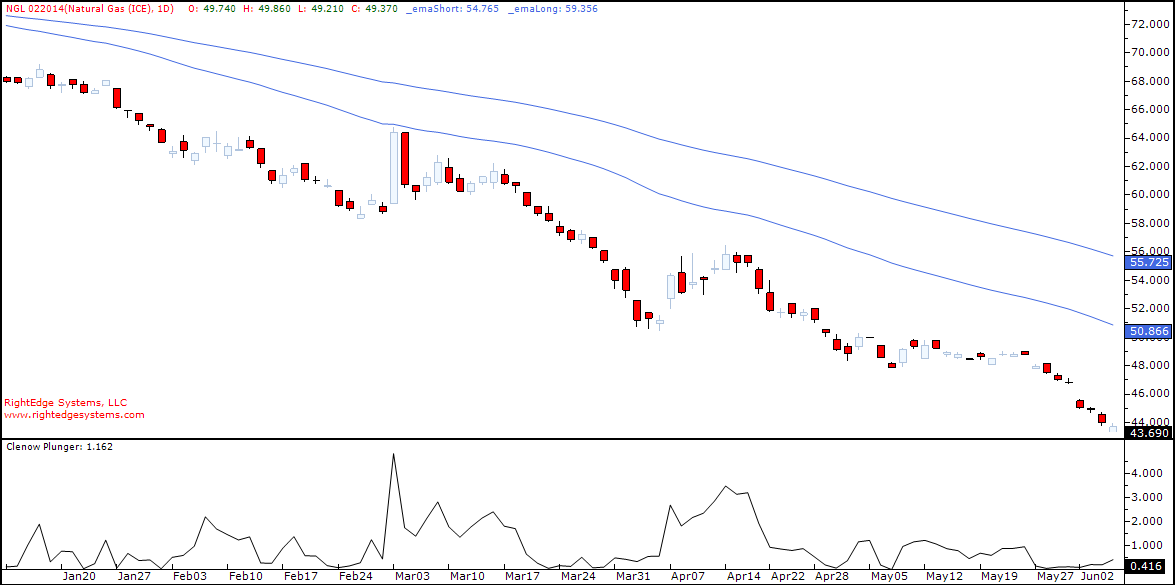
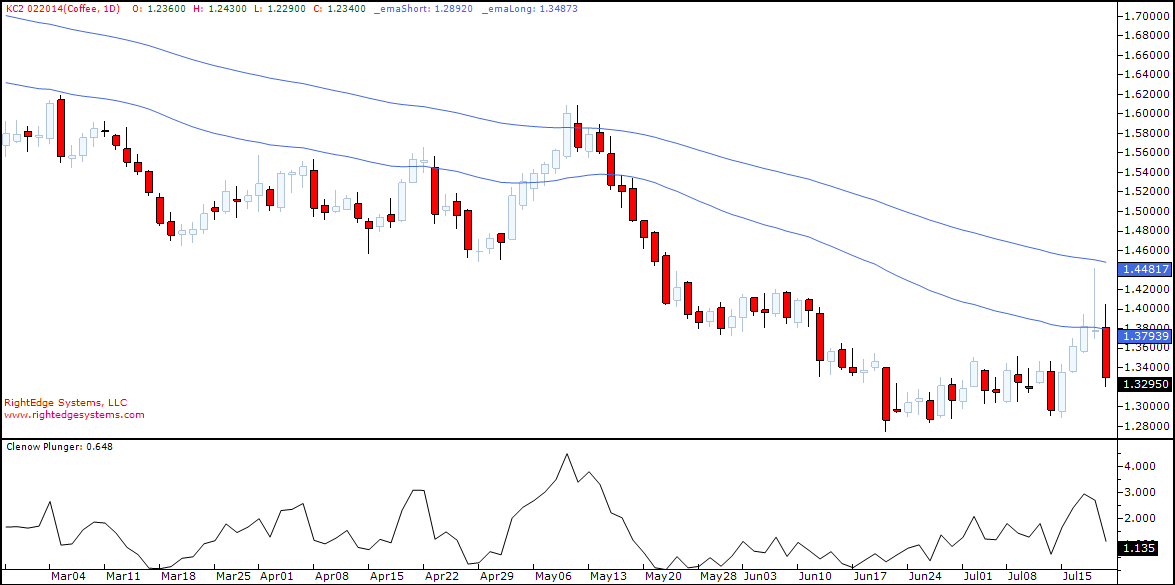
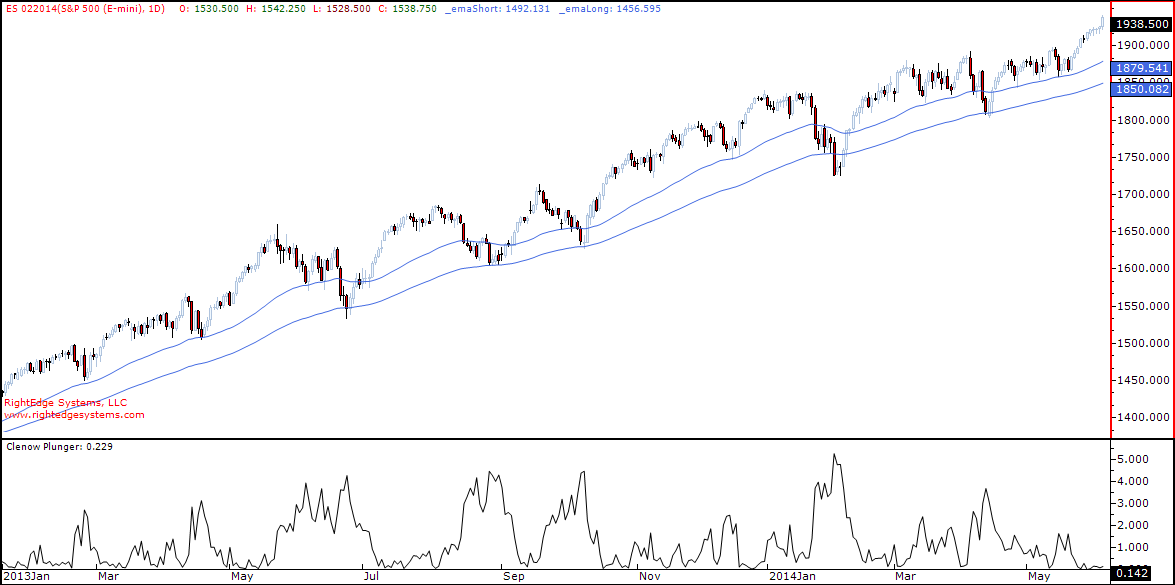
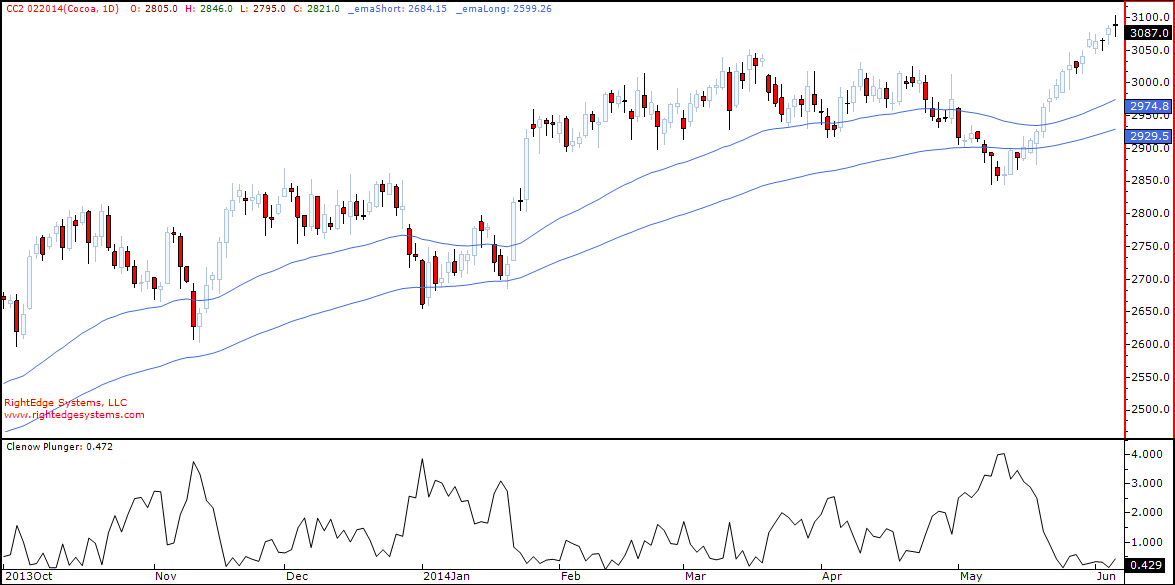
Note in these charts how the Plunger spikes up during pullbacks, just as it should. It measures the extend of the pullback on a normalized basis. In essence, it measured trend following pain levels. This can be traded in a few different ways of course. Having a good entry point is only part of making a complete trading model.
I might have mentioned before that I now publish a weekly futures analytical newsletter. Once or twice. Apart from covering a wide range of cross asset futures markets every week, I also do a special issue once a month. Next month, I’ll write about how to use this indicator to create a high performance trading model, complete with all the rules of course. If you’re not already on the mailing list, you can sign up for a free trial and receive this special issue.


looks very well! thanks a lot Andreas.
Hi Andreas,
For your readers who might use Amibroker, I have written an article on my blog http://backtestwizard.com/clenowplunger-afl/ which describes how one might write the ‘ClenowPlunger’ using AFL.
I hope that my definition of your indicator isn’t too far removed from how you intended it to be.
As ever, thanks for sharing.
Looks good, Llewelyn.
very nice indicator and looks very good to apply in the neo wave termination point ,i am trying to get a good combination with some other indicator to find the good counter trend trade
thanks for this kind simple indicator
Does anyone have this indicator built in the metastock format that they could share
Hello Dear Mr.Clenow ;
I am interested in Fx markets and try some systems which I find useful.
I found Amibroker formula of your Clenow Plunger indicator.I create basic Metastock formula but there are no color changes.
Could you please help me where can I find Metastock formula of this indicator with color changes ?
Thanks for your interest…
Best regards…
Sorry, I can’t help you there. I haven’t published any code for this concept so the one you found must have been done by someone else. I don’t use either Amibroker or Metastock and I’m not familiar with their syntax.
When creating a systematic approach, if the technical feature you want to test is relative rather than absolute (ie: an indicator is +/- 3% of its moving average rather than actually crossing the average), are you always going to have something with too many parameters? Or could you have a very simple trend following system that IS absolute, with a profit taking or counter trend module with a relative feature set without over fitting?
Try to keep is simple in concept. Sometimes you need a complex method of implementing a simple concept.
It’s hard to say that you need maximum of X parameters. You shouldn’t over complicate, but don’t focus too much on number of parameters either.
One thing you can do to reduce complexity is to use multiple trading models, designed to work together. Instead of one model that scales in and out, trades trend breakouts, reduces on overbought etc, you can use different models for different things. A few simple models that together accomplish the same thing. Then you can keep the logic simpler and analyze every component by itself.
I found that the real alchemy with this kind of entry is how you pair it up with a given exit strategy and filter.
It is also interesting to compare it’s dynamics against a similar alternative(e.g. in this “3atr” case, perhaps a buy limit x ticks below the 9 day low). On the face of it that might seem inferior as the 9 day low can squeeze in tight after a compression on low volatility after a 20day peak, getting in too “early” on many drops.
But, being early can ensure better performance in strongly trending markets that your relative strength filter may be selecting for, while the 3atr drop is twiddling it’s thumbs waiting for a kiss. YMMV.
As ever, it all depends on stuff. Your stuff. Is it good enough?
My stuff is always good, Richard! 🙂
Hi, Clenow.
Could this be termed a mean reversion model as well. Seems counter trend and mean reversion go hand in hand sort of.
Secondly, can this concept be applied to the stocks too? Thank you
Yes, you could call it mean reversion if you like. It’s a broad concept without clear definition.
The indicator works well for stocks too.