Where you looking for Trends of the World page?
You know, the one with the great market overview of ongoing trends in the futures markets? Or perhaps you were looking for term structured or detailed market data?
It has moved.
The Trends of the World futures table has been a very popular part of this site for years. It, along with other market analytics, has been available here for everyone. Well, I have good and bad news for you.
The bad news is that Trends of the World has become a part of the premium space of this site. Yup, that means that I’m greedy enough to actually want to get paid. Hey, we’re all in finance here, can you really blame me? Besides, there’s the good news. The good news is that the functionality and content of Trends of the World, as well as other parts of the premium section of this site, has been significantly enhanced and continues to increase in scope and functionality.
So what else does this premium section have?
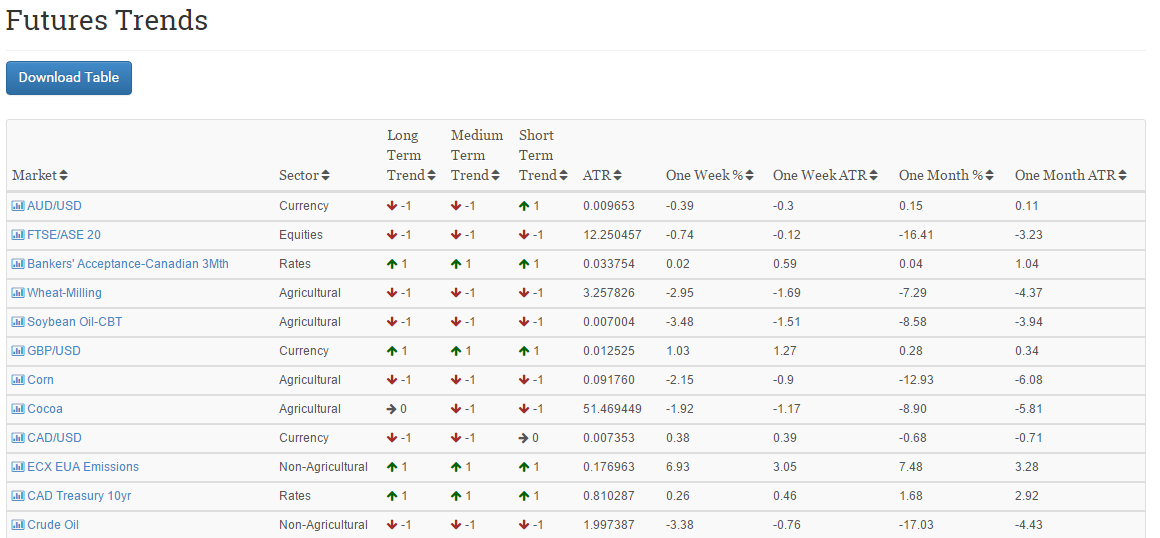
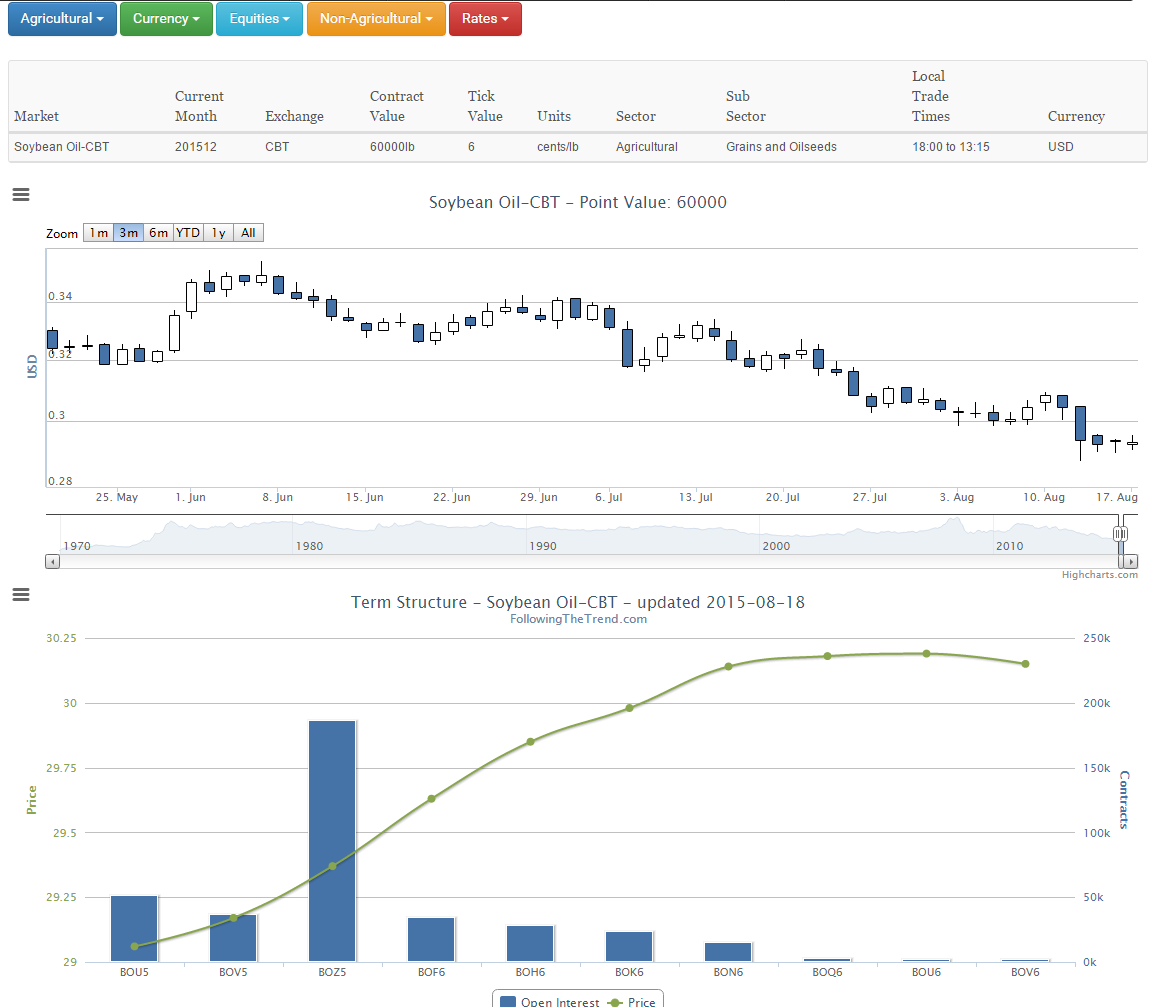
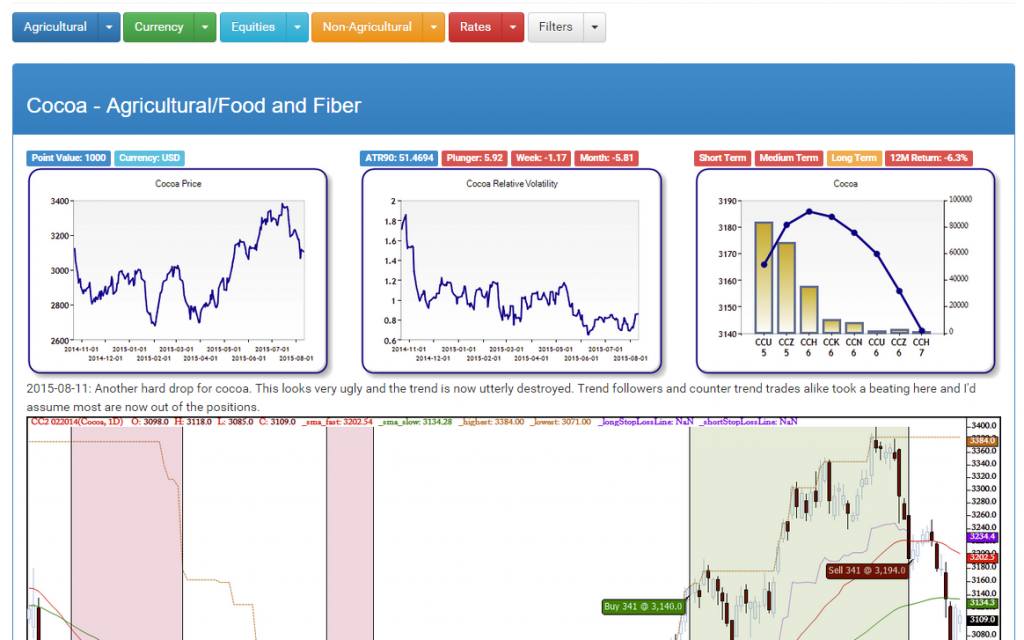
Let’s of things really. But let’s start with the weekly market report. This report covers around 70 futures markets, across all asset classes. It covers these markets from a systematic, professional point of view. The info displayed and analyzed is on a very different level from what you may have seen before. The displays show not only the trending status on four different time frames, it shows relative volatility over time, term structure and it’s implication for price development, counter trend indicator status and more. And of course, each market is annotated each week with market commentary by yours truly.
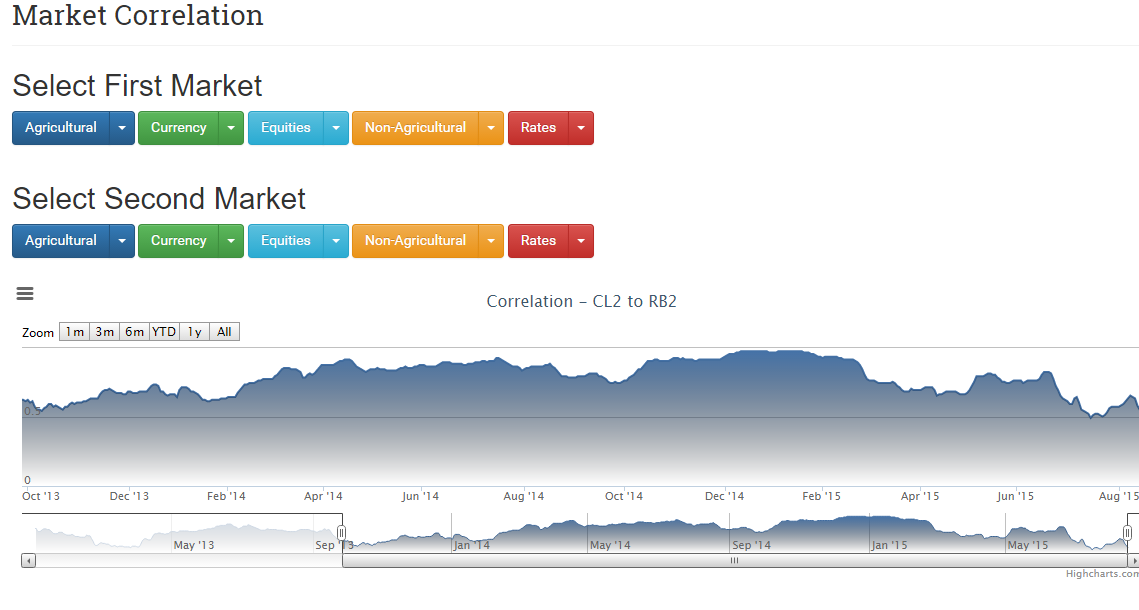 You’ll also have access to some pretty neat tools. The pair correlations chart is one of these. This interactive chart lets you chart the correlation pattern between any two futures markets over time. Here you can select two markets from any sector, and see how their correlation patterns change over time.
Oh, and you can of course also see correlations on a sector basis. Yep, you can select a sector, and see how the average internal correlations in that sector changes over time. Bet you haven’t seen that elsewhere. With this screen, you can see when the risks in a sector are going up or down. A high internal correlation is a bad sign for systematic traders, since the potential for diversification goes down.
 Or how about some live trading models? Complete with all the rules of course, but you’ll get much more than that. You’ll get a daily automated report of performance, trade signals, portfolio holdings etc.
Models of different styles are shown, and all the rules for these models and several more and presented in detail in the premium research section. Oh, I didn’t mention that? there’s a premium research section with in-depth documents, explaining complex topics and giving plenty of source code.
The premium research library has full source code for different types of trend following models, counter trend models, automatic quant reporting, and more. Advanced topics are explained and demonstrated. New documents are written regularly, often after requests by subscribers.
You had me at hello!
I never actually said hello, but I’m glad you’re convinced. Perhaps I won’t have to offer you a discount then.
I get a Discount?
Yes, yes, fine. You’ll get a discount.
For a limited time, new subscribers will be able to sign up for USD 99 per month. The regular price has always been $150/M. For those keeping score, that means a 34% discount. For how long is this limited time, you ask? Well, I don’t really know yet. Let’s see how this experiment goes first.
But I’m already subscribed at $150!
And I’m very grateful for that. Of course, you’re free to cancel your current subscription and sign up for this one if you like. No, I can’t change the price of the current one for technical reasons. And I can’t match the start and end dates if you switch, for the same technical reasons. PayPal works in mysterious ways.
$99 a Month? Wow! Where do I sign up already?
What happens after I subscribe?
Within 24 hours, but usually much quicker, you’ll get a welcome mail with your login details. This is still a manual process, to please allow for a few hours.
And then of course, you get the full glory of The Premium Section!
I’m interested in all your work on your website. Now, I will read your book and go from there. May I ask, is $100K enough for your methodology?
Regards
Eddie
Hi Eddie,
Most of the Super Systems sold for thousands of bucks are utter junk sold by people who never worked in the field and really don’t have a clue. The whole idea of the magical black box systems is created by such con men.
I’m not selling a trading system. I’m selling information and tools for you to learn and analyze the markets. I show you how we approach the markets on the hedge fund size and try to teach you a bit about what’s important and what’s not. It’s very far from these thousand bucks junk systems that you might have seen sold.
So why the low price? Well, why not? Most of it is automated, based on tools and information that I have in-house anyhow. The cost for me is marginal. I could go for a high price point and try to sell just a few, or I can make the information available to the general public for a low price and hope for a larger customer base. Either way, the product already has a comfortable profitability so any new subscribers are just profit.
Why be greedy when I can do it at a fair price and provide value?
The subscribe button above is not working. It takes me to the main paypal account login. It does not recognize the transaction for $99/month.
Thanks, Chris! Copy/paste error, but all fixed now.
I was actually starting to wonder why no one signed up yet… 🙂
Hi Andreas,
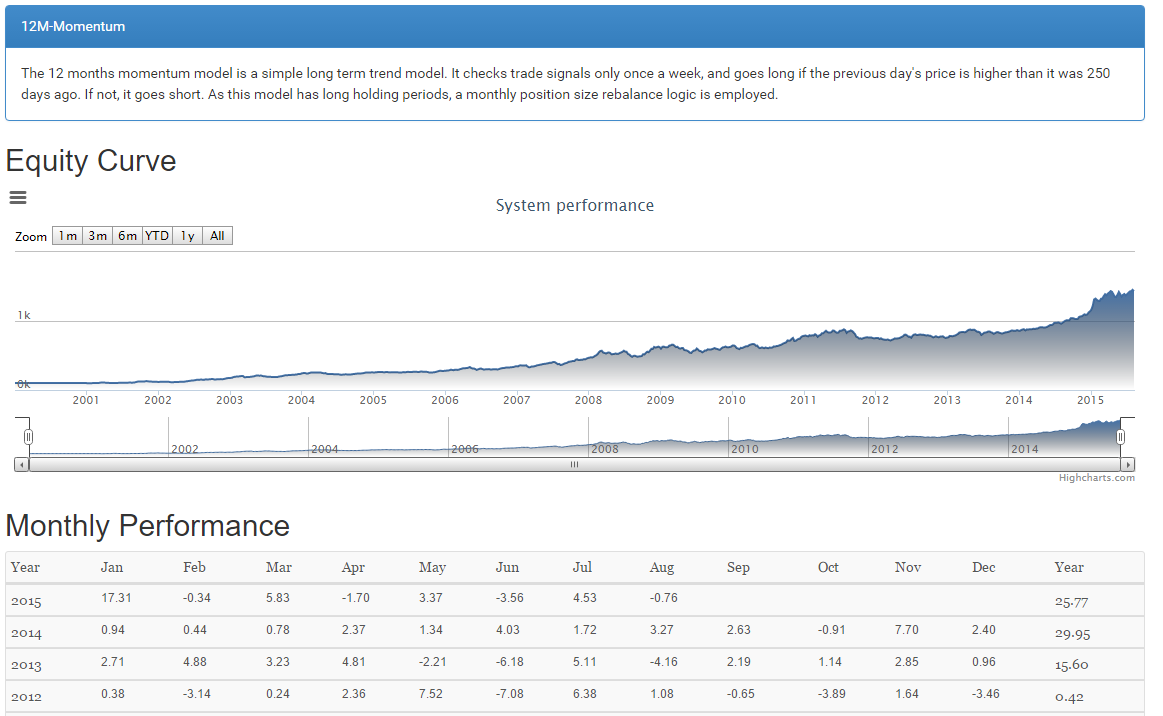
I studied your Year Momentum Model. Tell me if I am correct, please. You go long if price closed higher than 250 days ago and it must be Friday. So you go long on Monday? I guess your strategy is using 10 BPS as a risk factor and doesn’t have an exit rule. It just flips longs to shorts if price closes its 250-day low of Friday I guess. Am I correct? It is an incredibly simple strategy! 🙂 And it is obvious that this simple strategy has a higher MAR than the one you have in your first book. One more thing, I noticed you use for this strategy ATR (50). Am I correct?
I thank you in advance for your reply!
Regards,
Paul B.
Sounds correct, Paul.
And rebalance every 20 days, of course…
Greetings, Andreas –
Thanks for your book (SotM), a great read. It made me regret not having taking more math or that entry level stats class in college. (Sadly my education was deeply immersed in the humanities. Useless.) I’m tempted to take you up on your discount offer; however, I wouldn’t be able to make any sense of anything in the premium content section except the stock section (and only by virtue of having read your book). Have you considered (or would you consider) selling the stock portion of the premium content section at a reduced rate?
If your response is, “Are you kidding?” (my suspicion), my question then is: If I study the other sections of the premium content section really hard, will I be able eventually to devise a system by which I can identify non-correlated classes and to rotate from one (non-correlated) asset class to another based on signals such as system would provide?
Best,
Ken
Hi Ken,
Glad you liked the book! It does help with some understanding of basic statistics, but you probably won’t have to go too deep.
Regarding an equity analytics subscription, you’re absolutely right. I’m in the process of setting that up. The delay has mostly been in trying to automate the entire account creation process. My plan is to automate as much as possible and lower the price.
Perhaps you’d like to be the guinea pig? 🙂
The equity report contains a daily updated ranking table, momentum charts and a daily updated portfolio view of the model from Stocks on the Move. All positions, performance etc. I’ll add more tools to the report along the way. The price is $14.99/month.
The product page and signup button is here: http://www.followingthetrend.com/equity-momentum-report/
If I’ve managed to set everything up correctly, you should get an automated mail after signing up via PayPal, where you can create an account and get full access. If anything goes wrong with that, please contact me and I’ll fix it…
Hi Andreas –
As they say in guinea pig-land: oink oink! (or ‘soooie soirée’ in one of our esteemed institutions of higher learning, the University of Arkansas, whose football mascot is the razorback, a wild pig whose cries the fans imitate when their quarterback makes a score–oh, I just remembered: you don’t about quarterbacks. 😉
I’ve signed up via Paypal and await breathlessly for my first view of the premier momentum portfolio. The next obvious step, for me anyway, is to be able to test your momentum system on a variety of different indices (and you suggest several in your book). The S&P 400 (RWK) would be the first, but the QQQ would be interesting too, though it may be too intensively high tech and the financials would have to be added somehow. Over the last 15 years, it’s outperformed the SPY, though admittedly the ride has been more of a stomach-churner. You had indicated that Excel is not practical in automating the tables (SotM 80); is that so? I was going to try to replicate your system in it, but if it’s not practicable or do-able, then I’ll desist.
Now about asset rotation: I am seriously interested in a system that will signal timely switching from one non-correlated asset to another (ideally from a down-trending asset to an up-trending one, of course). Will the premium content enable to do that? If so, I’d convert $14.99 to $99 in a heartbeat.
By the way, there is a brokerage in the U.S. that will allow the purchase fractional shares. It’s called Motif Investing, and I’ve been using it for half a year now (it’s about 2 years new).
By the way 2, I tried to access information about ACIES product offerings through its website, but when I click on the icons all I get are larger images of the icons. The Globalanced Systematic Funds globe icon, for example, when clicked on, becomes a bigger image of the icon. I expected to be linked to a fact sheet about the fund, or similar information.
Please let me know if your premium content will enable me to make rotational decisions among non-correlated global assets. That, I think, is infinitely much more valuable than the relatively narrower scope of S&P 500 momentum portfolio.
Thank you.
Best,
Ken
Hi Ken,
Thanks for signing up! If all worked correctly, you should have gotten an automated mail with a link to a registration page. After filling out that, you should get access right away. If anything went wrong with that, please send me a mail and I’ll fix it right away.
Quarterback? As in “I’ll have a quarterback with cheese and fries, and please super size that”? Well, with a misspent youth of watching far too much American TV and movies, I have a pretty good idea what a quarterback does. He’s the one who get’s all the cute girls before they realize that the protagonist is actually the better choice…
On different indexes: It makes for a good research effort for sure. You’re likely to find higher returns, but higher vola on most smaller cap indexes. International indexes (MSCI World etc) are good picks, but they make things much more complicated. If you go too broad, you’ll likely need to put allocation constraints in place too. Only go that route if you really want to spend some serious research on it.
Excel is good at many things, but not testing trading strategies. It’s good for displaying the tables, but not for calculating the values. Not impossible, but hardly practical. You’d have to pull in historical data for 500 stocks, run a bunch of formulas to calculate numbers off that and put into the table. I use RightEdge as a calculation engine, pulling data from a local MySql, and pushing back the calculated values into the same db. Then I use my own C# application to display the results, but I also have an Excel plugin for displaying the result there. RightEdge also pushes the data into a remote MySql on this very web server, which is picked up by php/js and displayed in the premium section. And now you know how the sausage is made…
Asset rotation: This is in essence what trend following is about. Jump on the bandwagon of whatever’s moving at the moment. The futures report covers 70+ markets in all asset classes. It has a bunch of tools for analyzing the futures markets, my own weekly commentary, source code for trading models, automated portfolio reports etc. If you’re curious, sign up for the free trial and take a look.
ACIES: I’m making a point of keeping the actual business, asset management, very separate from my web based hobby projects, like this site. Since I’ve got your email address from the website, I’ll send you a mail about it.
Andreas
Thank you, Andreas –
Looking forward to ACIES mail.
As the official G.P. (guinea pig) for the momentum portfolio, I feel obligated to report that I’m unable to login. The login window recognizes my login (Ken!) and announces that it will automatically populate the password bar with the pw from followingthetrend, but then it doesn’t recognize my login. Clearly, I have no future in computers. And I’d like to change my login in to GuineaPig.
Ken
Oddly, my system tells me that you last logged in today, just a couple of hours ago.
I think I finally realized the problem with the logins. My brand spanking new user management system that I just installed on this site uses a *different* login system from WordPress. What this means is that users now have to log in using this page: http://www.followingthetrend.com/member-login/
I’ve removed the login box on the first page of this site to slightly lessen the confusion. Well, you live and you learn. Also, as the OGP, I’ll of course refund your first month’s subscription. No, I can’t stop it from happening because PayPal is weird that way, but I can refund it after the fact. Feel free to remind me about that when I inevitably will forget about it.
I’ll see what I can do about the user name. Not sure if the system allows changing it, and mucking about in the database tables will probably just upset it.
Hi Andreas –
Yes, able to log in initially, subsequent attempts failed; but okay now.
Thank you for putting up Friday’s chart, but I missed Thursday’s. Oink oink. Vis-a-vis Current Positions, do you think it would be worthwhile to add the date and price when each equity was introduced to the table? And to indicate changes in rank, sold positions and respective exit points and dates? Just asking.
One of your readers indicated that he was able to replicate your sausage-making with the Excel grinder, so while not practical, it is actually do-able?
Best,
OGP
Hi Ken,
Entry date could make sense, but entry price is trickier. The original entry price isn’t the same as the cap weighted average, and that’s where it might start to get confusing. Perhaps I should include both… Given the rebalancing, the average entry price keeps changing as we scale up and down..
Hm… perhaps the stock charts could show markers with buy and sell points. I’ll look into that. Another feature might be to show all transactions back in history. There’s a lot of them…
As to replicating in Excel: For the simulation, I’d say it’s pretty close to impossible. Making a table going forward, well that should be possible but impractical. If you do it all in Excel, you’d need to get the history into the sheet for 500 stocks (dividend adjusted etc), and do the math on each stock. Possible… If you have your data in CSV files for instance, you could VBA it. Read each file, one by one, do the math, store the results in the sheet, close csv, rinse and repeat. I’d advise against pulling all data into Excel at the same time, since you’d likely get some memory issues with that.
Btw, I sent you a couple of mails. Did I get your address right?
Hi Andreas,
Thanks for considering my suggestions which are intended to make your product more useful (I take my OPG role seriously). With that in mind, a couple of observations about the Equity Momentum rankings: (1) Are they not to be made available after each trading day? (2) The phrase “Adj. slope” in the website appears as “reg_slope” in the download, though the numbers appear to be the same–just want to confirm that it is indeed the adj. slope (and not reg. slope) numbers that are reported.
Best,
Ken
Ranking table improved. Better headers, better file name etc.
Hi Andreas,
For want of a better place to post this, I had a question regarding your latest intelligence report. You comment that (2015-09-08) “Gasoline is a little bit different, as it’s in backwardation and the others in contango. When things normalize in the sector, this is the one that will be the strongest”.
Could you perhaps expand on your thought process to why you see this to be the case vs. other energy commodities that are in contango?
I guess I better set up a forum for subscribers… I had that in mind for a while.
Well, briefly: Contango is bearish, backwardation is bullish. All things equal, of course.
Why? Because if the underlying doesn’t move a cent, each point of the curve in contango will have to come down. That’s just simple math. In backwardation, the opposite. If underlying doesn’t move at all, each point will very slowly move up a little each day.
Never forget that futures are not spot. The curve is vital in many futures markets.
Take the extreme examples. Natgas was falling for a decade. A 90% drop in the futures. But the spot was more or less the same. Or the VIX. That market is completely driven by term structure. Compare adjusted VIX futures and the VIX index, and they look nothing alike.
Hi Andreas –
Thanks for EqMo ranking of 9/9–surely posting it is automated? Another observation: Stock Charts link only goes to AAPL; once there, any other inputted symbol fails to pull up a new chart.
Best,
OPG
Chart bug fixed. Thanks!
The rankings, and almost everything else on the site, is fully automated. My alternative was to buy some Oompa Loompas to type it in manually every day, but it seems like some labor regulations would require owners to house and feed their Oompa Loompas these days.
Hi Andreas –
Paper trading the rankings table since last Thursday: 30%+ annualized. The only things filtered: max_gap 10 and below and positive trend. Then simply selected, starting from the top, equities until the weightings added up to 100 or closest without going over. Did not check if individual equities were below their 100-dsma. When the Stock Charts component is functional, presumably that will be do-able on site.
In determining market regime, is weekly chart over a period of 10 years acceptable to track .spx 200-dsma?
To clarify: in tracking medium-term momentum, is it 90 calendar or trading days?
Thanks.
OPG
Market regime: I use a simple 200 day moving average. It really doesn’t matter much though. This is a very crude filter, to make sure that you won’t be long during bear markets. There are hundreds of other ways of doing it, and there’s no reason to think that those ways are any worse. I just picked a standard, simple way of doing it.
The analytics are always expressed in trading days, i.e. data points.
You can see the individual stock trend filter in the ranking table (the 100d sma).
Another thought: Maybe a quick recap of the SotM rules could be made available in a link under the Equity Momentum category?
Let me know when OPG becomes PIA (pain-in-ass).
Thanks, Andreas.
A semi-existential thought (for those of us who may not have access to other asset classes): Momentum is momentum is momentum, yes? Even in a bear market (in other words, trading with the market regime filter removed), there are going to be a few stocks that will move sufficiently to capture some alpha?
The stock ranking table doesn’t materialize until after 10AM Pacific Coast Time, leaving 3 hours to the end of trading day to analyze and make position/portfolio changes. It’s plenty of time, but in case one gets caught up in a meeting or extra-long lunch…
I’m thinking of making both position and portfolio changes weekly (instead of weekly and bi-weekly as suggested). More often reduces volatility, yes?
Thank you, Andreas.
Ken
Andreas, I take it back: it’s now 23:00 hours on 9.19.15 (Sa) and stock ranking table of 9.18.15 (F) has yet to materialize. Oink-oink!
Off’l GP