Last week I wrote about the dangers of analyzing the wrong time series. This is still a very common mistake made by traders and analysts and I cannot stress enough just how important it is to get your data right. It’s not a matter of opinion. Just math. Simple continuations without basis gap adjustments are just plain wrong and so is any analysis performed on those data series.
All too often I see sell side analysts posting long term charts using these highly flawed data series and then applying some magical numerology to it, calculating a 38.1966% retracement based on a data series that has about as much basis in reality as the numerology applied on it. Well, I’ll leave the attacks on numerology for a different time and tackle the data series this time.
In the article last week, I briefly mentioned the concept of term structure. This refers to the difference in the price in an asset for different delivery dates. In this article I’ll take you a little deeper into this concept and try to explain why it’s of absolutely critical importance to a futures trader. If you trade any futures markets above the most simplistic equity markets, you most certainly need to stay aware of term structures and how they are likely to impact your profits and losses.
The shape of the term structures can indicate a directional bias. Ignore it at your own peril.
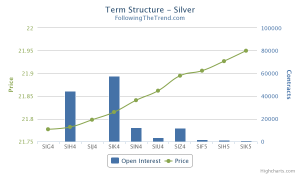 The graph to the right shows the current term structure of silver. Note that all points on this chart relates to the silver futures, but for different delivery dates. The green line connects the current prices for these different dates. Note how each successive contract is a little bit more expensive. That’s the normal state of affairs for futures and is referred to as contango. If the prices are lower in the more distance contracts, it would be called a state of backwardation.
The standard futures tickers for each contract is shown, where for instance SIH4 would be the Comex silver contract with March 2014 delivery. The blue bars show you the open interest at each point. This information is not really part of the term structure, but it seemed like a useful thing to add. Generally speaking, you’ll want to be in the most liquid contract. The most liquid contract is the one with the highest blue bar. Open interest is simply a running count of how many open contracts there are at any given time.
The difference in price for these contracts has nothing to do with expectations of spot price change. That’s a common misconception though. The price difference reflects cost of carry. Always keep in mind that if you can hedge something, you can price is. In this case, hedging a futures position would entail buying the physical silver at the current spot rate and storing it until delivery. That takes cash, so you have to factor in the interest rate and of course storage cost. Most of us never actually do these things, but the prospects of arbitrage keeps the futures prices in line, reflecting these conditions.
The term structure shape for physical commodities have more factors involved than the financial markets. For the Nasdaq futures for instance, hedging would involve borrowing money and taking outright positions in the index constituents. So the interest rate is therefore the main factor, as no storage and such would be applicable.
Ok, enough theoretical stuff. If you’re still reading so far, you’re wondering where I’m heading with this and how it has any bearing on real trading. Well, try this thought experiment on.
Look again at that silver term structure. Spot price at the moment is 21.6 while the December 2014 contract is priced at 21.95. What would happen if the spot price stayed exactly the same until the end of the year? The price of the December 2014 silver, SIZ4, would fall by a microscopic amount each day until it hit exactly 21.6 on the very last day of trading.
Term structure can indicate directional bias
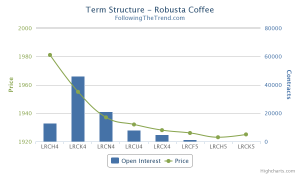 Perhaps you don’t think that this is a very big price move. Well, this wasn’t a very extreme example. But you still have a directional biased on the futures price, shown clearly by the term structure. If the asset you’re looking at would be in a state of backwardation, you’ll find that you’ll have a positive bias in the futures price. If the market shows a steep or a consistent shape, this can have significant long term implications on the price. Just look at how the extreme contango in natural gas made the futures market lost over 90% in a decade while the spot price went sideways.
The term structure is just one piece of the puzzle, but it’s an important piece. If the market you’re trading shows a contango shape, you’ve got a negative bias. If the shape is of backwardation type, you’ve got a positive bias. There are naturally many other factors affecting the price but ignoring this valuable piece of information would be dangerous. Just look at how the change in the shape of natural gas confirmed that this very special market had really changed.
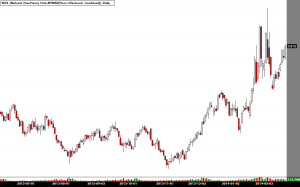 Natural gas has been in a very steep contango for decades. Every trend follower in the world and his grandmother has been short it year in and year out. It’s been one of those seemingly never ending cash cows. I’ve written about this miraculous market many times in the past and I’ve always used the extreme contango as the main reason to keep the shorts on even after all these years of declines. Recently that market has started moving up, and quite dramatically to boot.
In the past, any move up in the natural gas market was just a great opportunity to enter new shorts. After all, it always kept falling. The long term chart of natural gas looks quite insane, if properly adjusted for basis gaps. The most persistently trending asset, losing over 90% in a decade.
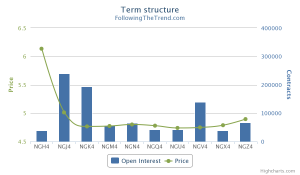 But now things have changed, it would seem. This market has always shown a very strong contango, but now that shape has dramatically changed. Look at the graph to the right. Yes, the natty is now in backwardation. This changes the picture significantly. Perhaps it will move back to contango, perhaps not. But for now, you can’t treat this market like the never ending short cash machine that it has been for so long.
I hope you’re starting to see the great wealth of information and value that term structure charts can bring. If you’re actively trading futures, you should take a look at these shapes at least once a week to stay aware of any important changes.
The problem is of course that this data is not easily available unless you have access expensive market data terminals. At least I have been unable to find a good online source built for this purpose. So I made one myself. I collected freely available data from various sources, structured it and visualized it for you.
You have have noticed that I added a few tools of this kind recently. Professional grade analytics, made available on this site for free. I’m doing this as a bit of a test. If enough people are using it, I’ll keep adding more of these kind of tools and improve the existing ones. If you want to see more of these things added, help me spread the word and increase the user base. Ideas and suggestions for new tools are of course very welcome.
Futures Term Structure Charts
 Following the Trend


Thank you so very much for giving these Term Structure Charts. Is thre any way you would give access to a Corellation Matrix updated daily or weekly.
I think I am intelligent about markets. I am a physican. Taught myself finance. I manage my own money. Simply do not have the capital to any for a Bloomberg Terminal. Most of he information on the net is garbage, like corellation matrices built out of price corellation. Price is neither normal nor linear which are the assumptions behind the Pearson corellation.
Anyway, thank you for what you provide free and would be gret if you give access to even a basic Asset Corellation Matrix. Would be nice if you reply to my Email but underhand if you don’t.
If you ever visit Chicago send me an Email.
Correlation matrix is one of a few more gadgets I’ve considered adding to the site, doc. I want to make sure people out there are actually using my tools before spending too much time building new ones. The higher usage I see on these tools, the more features I’ll make.
I will second what Dr. Ahmed suggested – a correlation matrix for the markets on “Trends of the World” updated once per week / month would be immensely helpful! Andreas has been kind enough to make so many useful resources available on this site – “amazing” doesn’t do his efforts justice.
Very useful! These details are often overlooked, but over time may significantly add to trader’s bottom line. Another such a concept is currency hedging. Andreas, would you consider writing up article about currency hedging in futures trading? I believe many readers would very much appreciate it!
Hi,
in your opinion, should this influence trading decisions, i.e. how is it included in backtests?
a) as filter for long/short positions?
b) position size adjustments, i.e. if the current term structure tallies with your buy/short signal, increase position size, otherwise reduce it?
thanks for posting, I’m considering a look into your premium area. It’s solid advice.
Term structure is of vital importance for many markets. Remember of course that it’s somewhat included already in a properly adjusted continuation. Still, there are plenty more things that term structure can be used for, and there’s very little being written about it.
If you’re looking for areas of research, I’d suggest that this one should be one of your top priorities.
http://www.followingthetrend.com/term-structure/?ticker=NGL with an updated date of ‘2015-06-30’ shows a hump in the middle of the term structure, much like an ‘n’ character.
Is there a definition for this?
What could be some of the implications/risks of term structure of this shape?
Would this indicate that hedgers are locking in prices for later delivery now because they think it will fall further? The open interest seems high (without any knowledge of what typical open interest histogram normally looks) in the middle of the term structure as well.
Interested in your thought on this, and any further hints as to what I else I could read to learn more on this.
Great site BTW.
Term structure gets interesting when it’s very steep, very unusual or very persistent. NG for instance was falling for many years, solely because of the contango. At the moment, the shape isn’t steep enough to make much impact and we have no real trend.
Hey Andreas,
a very good article and a wonderful reminder of the mother of all short trades. Thanks!
I just stumbled about a paper that you surely know called “Facts and Fantasies about Commodity Futures” (http://www.nber.org/papers/w10595.pdf).
On the pages 22/23 a comparison is shown, describing the difference of going long “high basis” future (f. in backwardation) versus going long “low basis” futures. The stated average return difference between the long “high basis” (backwardation) versus long “low basis” between 1959 and 2004 shown there is about 10% on an annualized basis. Although a long/short strategy is not explicitly mentioned it surely comes to the mind of many traders reading that numbers. They seem to good to be true, considering that not even a money management approach is used.
As it is clear that disregarding the term structure may cost the trader more than his nerves, but do you think using the term structure on a stand-alone basis could be sufficient? Have you ever seen a working trading system just using the term structure and a money management approach?
Best regards, have a nice week
Nick
The term structure is a valuable input variable, but I’ve never traded with that as the only factor. Measuring the steepness of the structure is a very important factor, but unfortunately not possible in most retail software packages.
It would be an interesting idea though. I don’t think it’s realistic, but it would be a fun test to see what happens if you trade on steepness of the curve alone.
If you just look at a continuation, even a proper one, you’re missing out on this piece of the puzzle. Many markets are completely driven by it.
It also always make me shake my head when so called professionals, usually sell side technical analysts, use spot markets or unadjusted futures in their reports. Like when someone draws lines on a multi year chart of XAU and then makes recommendations about futures trading. It shows that they missed the whole plot.
Hi,
thanks, Andreas! Seems as if a lot of retail investors do not have a clue that a lot of “Zertifikate” based on futures baskets are no plays on the spot price. The unexpected price moves of these papers often lead to a bashing of the issuers for “manipulating” the prices. Although this products are in a way rip-off products, in the end – as you say – many people simply do not know what they trade.
If I find the time I will get some correctly adjusted data from Bloomberg and will look where using the steepness of the curve or rate of change of the steepness (or sth. else…) leads me. Good stuff to practice RE during the evaluation period.
Pretty good site, did I mention that?
Best regards
Nick
Danke, Nick.
It’s amazing how often people, even so called professionals, buy things that they just don’t understand.
My favorite example is a former business partner who had spent 40 years in a prestigious private bank, earning millions a year. One day he tells me that he believes that the dollar will crash and that gold will skyrocket. Nothing new there, it’s a common theme that Swiss bankers have been saying longer than anyone can remember.
But his conclusion was to buy a CHF denominated gold ETF. So that he wouldn’t have dollar.
I spent three hours trying to explain that buying this ETF means that he goes long the dollar, but his lack of understanding of synthetic positions just made him increasingly upset. If he wants to go long gold and short dollar, just buy gold against dollar. At one point, he even slammed an 80k Patek in the table and asked if I thought there was a dollar exposure on that too. These kind of meetings explain how a lot of irrational decisions can get made in banks…
He ended up taking a position for about ten million in this ETF. To protect about a dollar crash, he accidentally went long the dollar. Good thing he was wrong about that dollar crash. Too bad he was also wrong about the gold rally.
For readers not familiar with synthetic positions: Buying gold in CHF would have the same return profile as buying gold in dollar and then buying dollar against Swissie… Go long GC and short SF, and there you go.
Hey Andreas,
great story! There are a lot of reasons to keep our sector alive, one is the everlasting flow of entertainment.
What really strikes me is not that people fail to grasp some more complex math. I think more money is lost (or at least risked) on the basis of not understanding the basic stuff beginning with the rule of three. FX hedging comes to my mind…
Best regards
Nick
That’s an advantage that FX traders have. Real FX traders that is, not the yahoos on the internet with their pips and robots… If you’ve ever worked at an FX desk, you understand how every position, always, is long something and short something else. Three way FX pricing is of course another basic concept that’s applicable to so much else, but people from other sectors don’t seem to get it.
Hello Andreas,
I’m trying to learn more about the ins and outs of futures term structure and thought you might be able to suggest some relevant resources.
I’ve read this article and the other public publications on your site but still feel like I’ve just scratched the surface regarding the relationships between contract months, basis, etc that are right in front of me. I feel like these relationships tell a story though I’m not sure how to correctly interpret what I see.
Are there any books and/or papers that you like in this area and that you’d recommend?
Thanks,
Robert
Hello Andreas,
In your article Term Structure Shows the Way at tradingfloor.com you used an example of NG which had an implied annualized yield of >20%.
You made the comment that such a large increase is not likely to happen.
My question – is the high-level general principle when analyzing term structure yield that a very high positive yield is bearish and a very high negative yield is bullish?
Seems like that’s the case. What “very high is” is a different question.
Thanks