Trends are starting to come back into play. What we’ve seen the past few months has been a slow turnaround in the managed futures performance across most funds. The problem in the past years has been the single-mindedness of the markets. At any given time, a single overwhelming worry has been driving the markets. The reason it self has varied. Sometimes everything is driven by the fear of this one factor. At other times by the relief of the perceived lessening of the same factor.
As the global markets have been pushed between two extreme views, correlations increased. In the managed futures games, correlations is the enemy. At times correlations can generate large returns in short time periods. But more often than not, correlation is what steals your money.
Let me first show you were the trend followers stand at the moment. Then we’ll look at how the correlations have changed.
The December performance was overall on the positive side, albeit not by much. I have written before about the increasing danger that this low yield environment poses to trend followers. Most standard position sizing algos will take on larger and larger positions in this environment. Most standard trend systems keep buying the breakouts as if it’s business as usual. Following this method means blindly accepting an asymmetric risk to the advantage of the guy on the other side of the table. Trend followers who stuck to default systems got hurt badly last year.
| Name | December % | 2012 % |
|---|---|---|
| Abraham Trading Company Diversified Program | 0.7 | -5.5 |
| Adamah Capital LLC Diversified Program | 1.0 | -12.3 |
| AIMhedge Management Ltd AIMhedge GDF Classic EUR Institutional | 2.0 | -5.8 |
| Altradis Capital AG AlphAlgo | 1.0 | -17.1 |
| Amati Global Investors Ltd Systematic Trend Fund | 2.5 | -13.5 |
| Campbell Company Global Diversified Large | 3.7 | 1.3 |
| Chesapeake Capital Diversified | -2.5 | -17.8 |
| Clarke Capital Management Worldwide | 4.9 | 25.0 |
| Drury Capital Diversified Trend Following Program | 1.9 | -4.7 |
| DUNN Capital Management World Monetary and Agriculture Program WMA | 2.6 | -18.6 |
| Eckhardt Trading Company Standard Plus | 0.0 | 3.7 |
| Eclipse Capital Management Global Monetary | 4.7 | 7.3 |
| Estlander Partners Alpha Trend | 0.4 | -8.5 |
| FORT LP Fort Global Diversified | 1.6 | 7.1 |
| Globalanced Futures | 1.9 | -13.4 |
| Heyden Steindl GmbH TOMAC2 | 8.9 | 16.9 |
| Hyman Beck and Company Global Portfolio | 3.7 | -19.6 |
| IKOS IKOS Futures Fund | 0.1 | -7.5 |
| IKOS The IKOS Hedge Fund | 0.3 | -5.2 |
| Incline Investment Management LLC The Tahoe Strategy | 1.8 | -14.4 |
| ISAM ISAM Systematic Fund Class A USD | -0.2 | -17.5 |
| John Locke Investments Cyril Systematic Program | 1.6 | -5.1 |
| Kaiser Trading Group Kaiser Trading Group | -0.3 | -1.3 |
| M S Capital Management Global Diversified Program | 0.3 | -16.8 |
| Millburn Corporation Diversified Program | 1.5 | -5.3 |
| Mulvaney Capital Management The Mulvaney Global Markets Fund Ltd | 0.8 | -33.7 |
| NuWave Investment Management LLC Combined Futures Portfolio Ltd | -1.5 | -16.2 |
| Qbasis Fund Management Qbasis Futures Fund A | 1.8 | -16.6 |
| Quality Capital Management Global Diversified Programme | -0.4 | -3.1 |
| Quantica Capital AG Quantica Managed Futures | -0.4 | -4.4 |
| Quest Partners LLC AlphaQuest Original Program | 1.1 | 0.9 |
| Quicksilver Trading Diversified Program | -0.6 | -31.8 |
| Rabar Market Research Diversified Program | 0.1 | -6.7 |
| Sunrise Capital Partners Sunrise Capital Diversified Ltd | 0.6 | -23.2 |
| Superfund Group Superfund Green L P Series A | 2.1 | -14.1 |
| Transtrend B V Transtrend Diversified Trend Program Standard Risk USD | 0.3 | 0.3 |
| Welton Investment Corp GDP Program | -0.7 | -8.2 |
| Winton Capital Management Diversified | 1.4 | -3.6 |
Historically a very large amount of trend following returns have come from interest rates. Both in playing the multi-decade bull market in bond prices and by cashing in on interest income from free capital. There is little reason to believe any of these factors will be around in the next decade. We all need to adapt and squeeze more money out of the other asset classes to make up for it.
The good news is that the opportunities to diversify are increasing lately. In single factor market regimes, diversification is but an illusion. But what we see now is an increasing decoupling between asset classes. Compare the images below. Click on images for larger view.
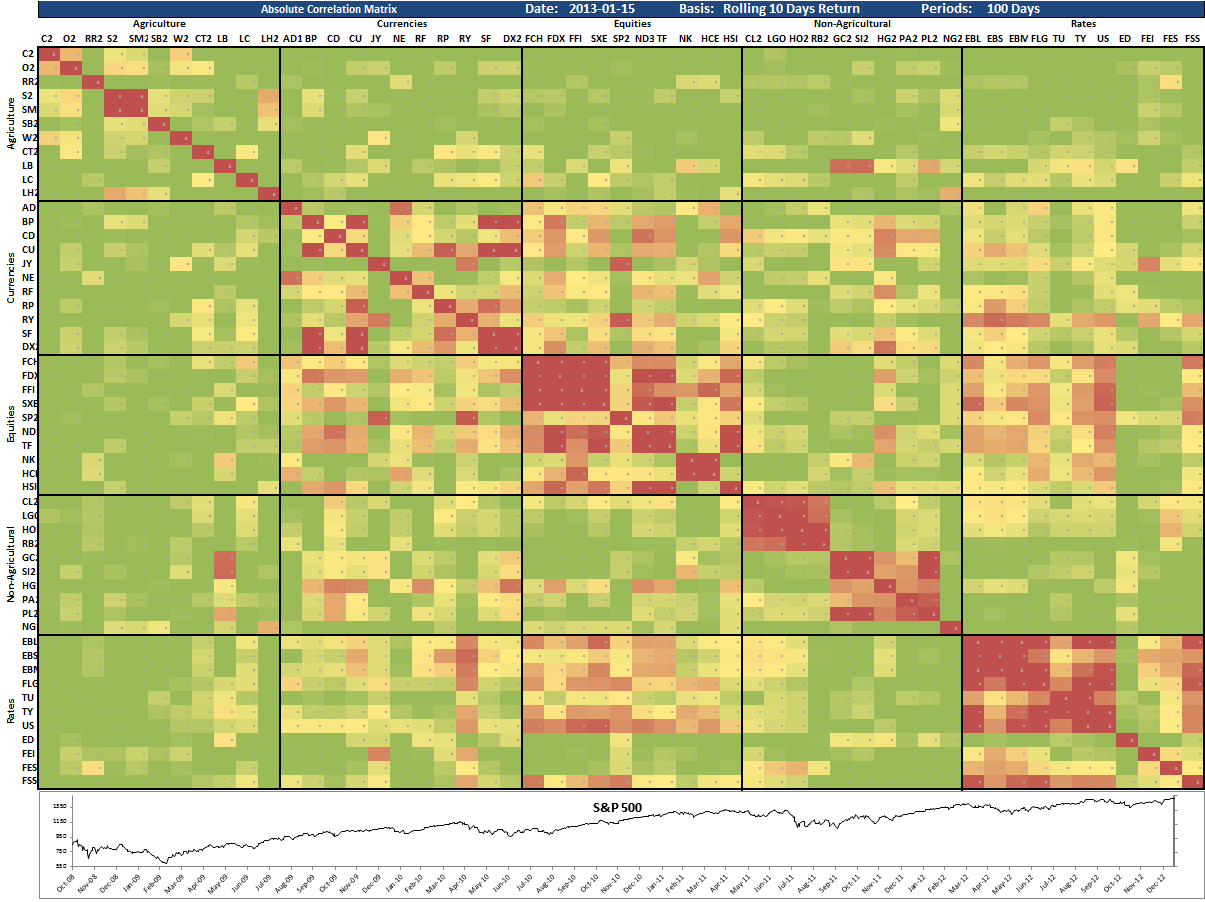
Correlation Matrix 2013-01-15
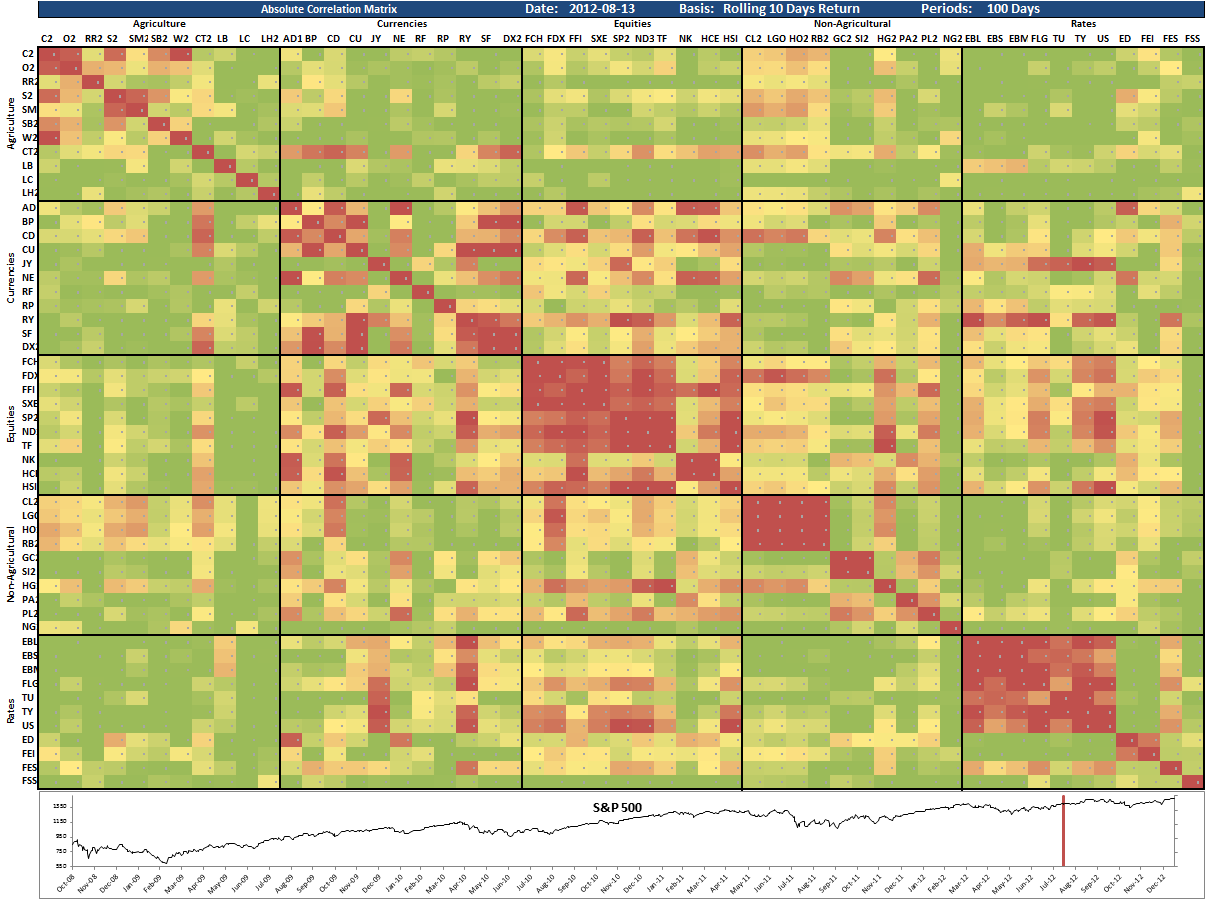
Correlation Matrix 2012-08-13
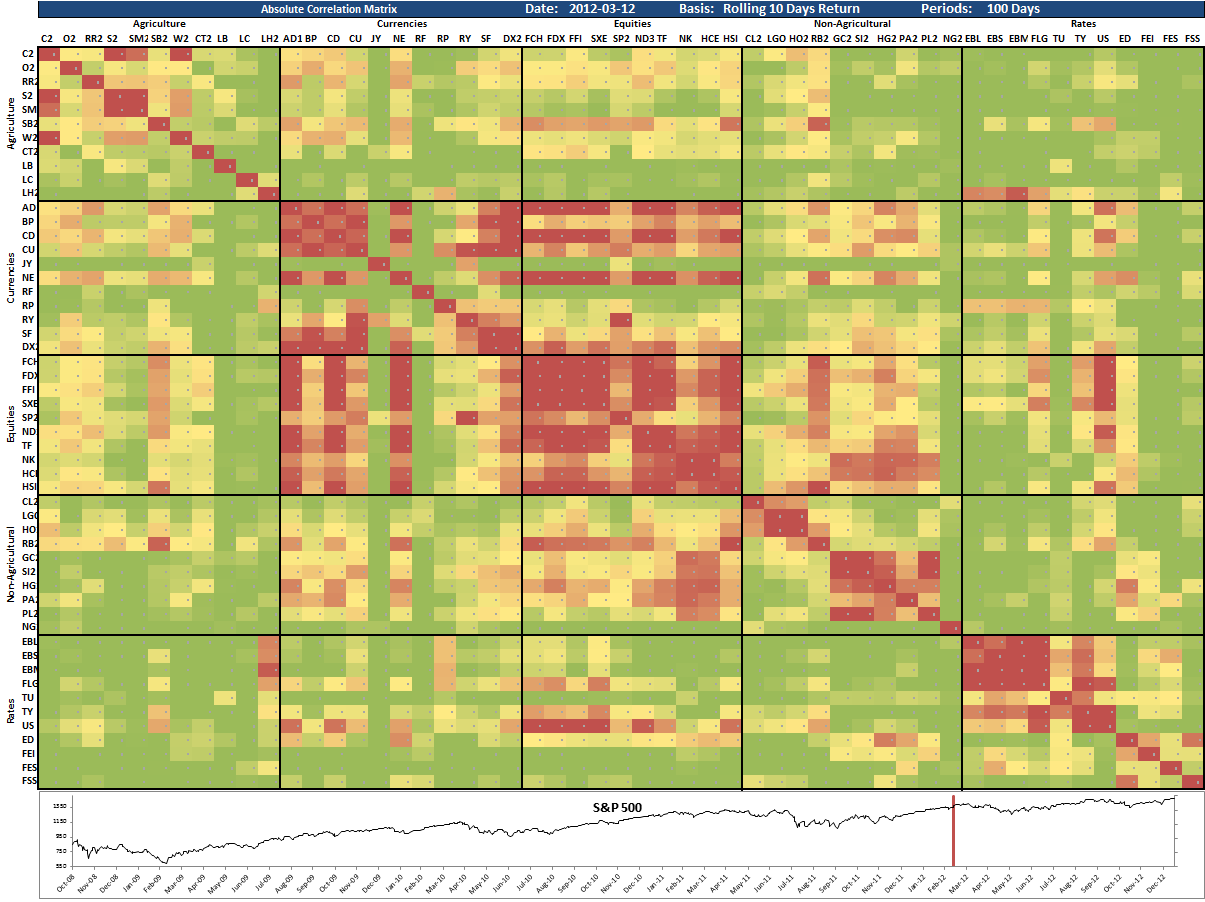
Correlation Matrix 2012-03-12
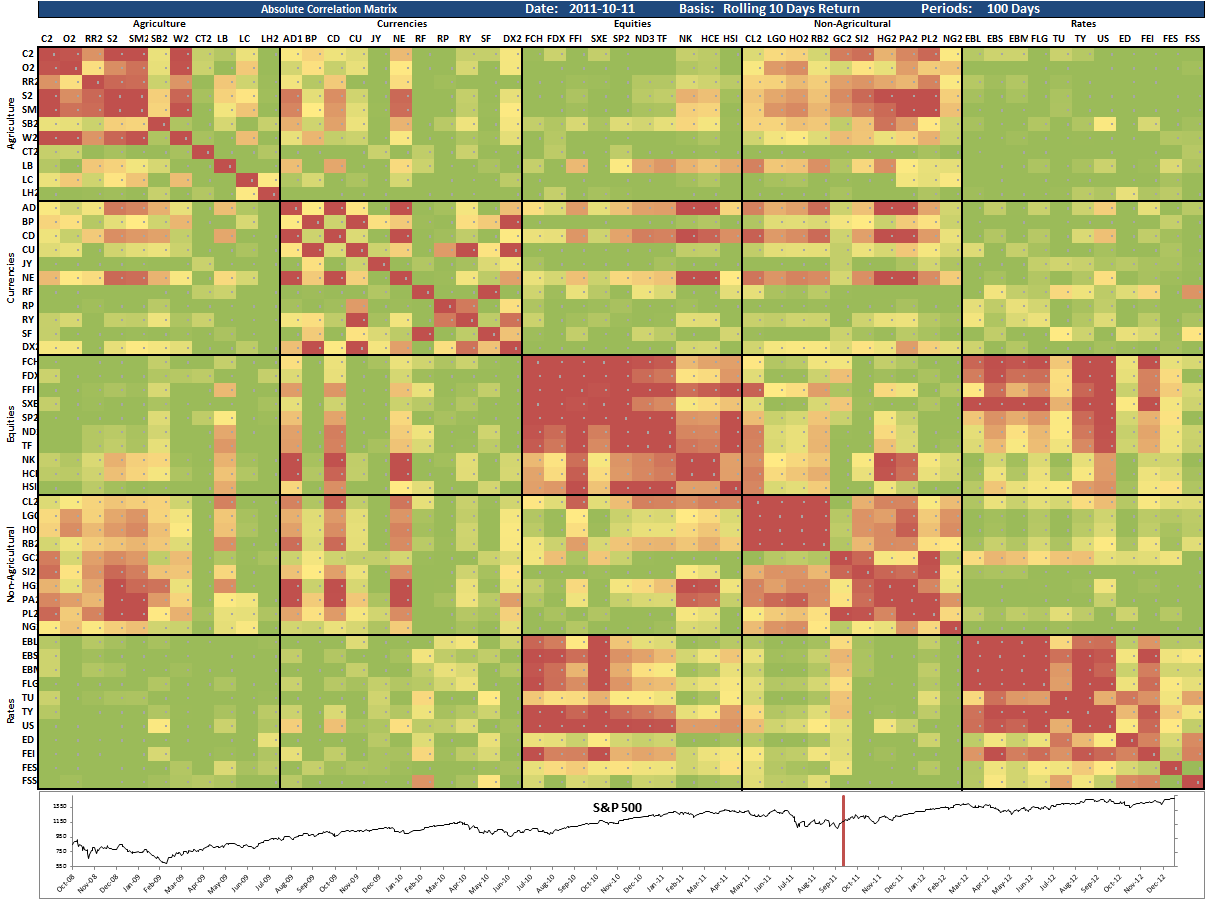
Correlation Matrix 2011-10-11
The red color shows the highest correlations at the time. Remember that correlations are evil. The relatively low overall signs of cross asset correlations at the moment is a very positive sign. That we still see high internal correlations in the equities and rates sectors is quite normal. This will practically always be the case. Some higher internal correlations in energies and metals is not a big problem either.
The current picture shows improvements week by week in the correlation patterns. Why is this good for managed futures? What we do is to take on a large number of trades in highly diverse sectors and asset classes. The idea is that some wins, some loses but over time we make money. When correlations are high however, there is no diversification advantage anymore. All those trades, really just amount to one huge bet. That’s when we start losing on all trades at the same time. That’s whats been happening the past two years.
Is it over? Are we back to business as usual? There are signs pointing to that. But then again. I’m not market forecaster. I don’t make predictions. In spite of popular belief, that’s not what we do in the managed futures hedge fund space. Time will tell.