I’ve written in the past about how RightEdge is one of the best simulation platforms on the market. The only issue with RightEdge is that it can be a little tricky to get started. If you’re not comfortable with programming, it’s not that easy to get your data hooked up so you can start modelling. Perhaps the new RightEdge plugin for Norgate Data can solve that issue.
An Australian data provider for American stocks?
I’ve known about Norgate for years, as that Australian data provider specializing in providing integrating tools for AmiBroker. I’m not a big fan of AmiBroker, so I didn’t pay that much attention. It seems like an ok platform, but they lost my attention as soon as I realized that it’s based on some sort of proprietary scripting language. If you’re serious about quant modelling, you need to use a proper programming platform.
Still, I kept hearing good things about their data and some custom tools that they made for AmiBroker. In particular I was impressed by how they solved the issue of survivorship bias, which happened to be the same way that I solved it internally. A while back, I contacted Richard who owns Norgate to discuss if they would consider making a custom data adapter for RightEdge. Turns out he had already started planning for this. It took a little while to get done but it turned out to be a pretty interesting solution.
An Integrated Solution
Usually a data provider isn’t much to get excited about. I mean, either the data is good or it’s not. It’s nice with decent coverage and such, but there’s not a whole lot of variables that can differ. Most data providers provide a standardized format or an API, and leave it up to you to build an adapter for your simulation platforms and databases. This is just fine and that’s how I would normally work. Buy the data you need, build your own interfaces and adapters. For some reason though, most people don’t want to break out a compiler just to get the data into the simulation software. Go figure.
This is where the solution from Norgate gets interesting. They didn’t just build a normal data adapter. They made an integrated solution that not only gets your time series in a row, but also solves a few other tricky issues. It’s the most comprehensive solution I’ve seen from a data provider.
Here’s what they cover:
- Time series data for American and Australian stocks.
- Optional total return series.
- Stock graveyard – delisted, merged etc.
- Historical index joiners and leavers info.
- Global, cross asset futures time series.
- Global forex time series.
- A bunch of things I never used, including economic data, cash commodities, corporate bonds, convertibles, options etc.
What’s interesting here isn’t what they cover. That’s great coverage, but there are many other data providers that cover that much. No, the interesting part is the RightEdge integration, especially on the equity side.
Getting the Data Right
The number one mistake that hobby traders do when modelling equity trading systems is that they don’t use total return series. The reason for that is that total return series can be hard to obtain for hobby traders. Almost everywhere you look, you see price series only.
If you punch up a chart of a stock in any website, you’ll see price series. Even on professional market data platforms such as Reuters and Bloomberg, you will by default see price series. The price series is not the true story. What this shows is the actual price over time, adjusted for corporate actions such as splits, but not reflecting the impact of dividends. That means that you’ll see artificial dips in the price whenever a stock goes ex-div. It looks like you took a loss, when you really didn’t.
So any stock paying dividends gets punished, and the higher the dividend yield the more the stock gets artificially punished in the price chart. This is why you need to use total return series.
In a total return series, you’ll see the real value development of the stock, assuming that you would re-invest the dividends. Why would we assume that? Well, we have to assume something, don’t we. We could assume that you pocket the cash and leave it in a checking account, but that wouldn’t make much sense.
When you model equity strategies, you need total return series. This is typically hard to find, at least at a price point that is reasonable for hobby traders. With Norgate’s new shiny plugin, you can decide yourself how you want your data adjusted. The right one to pick is the bottom one of course.
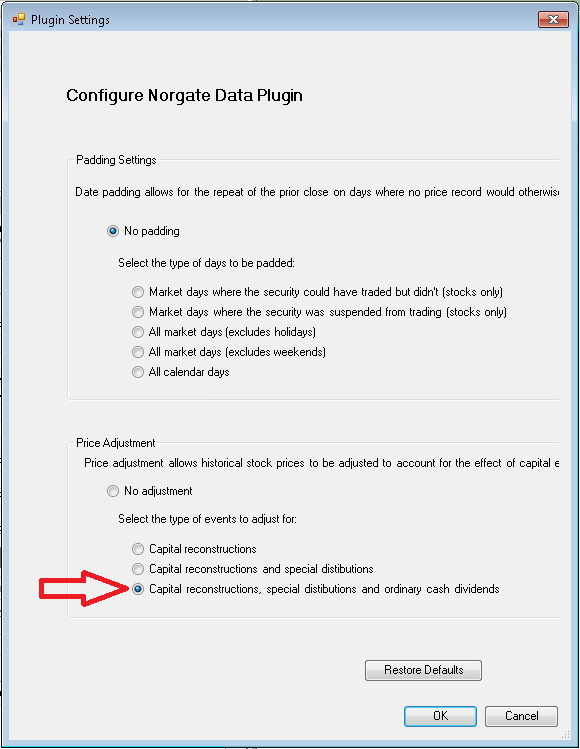
Get the total return option.
Visiting the Graveyard
The number one mistake that hobby traders do is to disregard delisted stocks. There are many reasons why a stock ticker can cease to exist. There could be a merger or an acquisition, or perhaps the company simply went the way of the dodo. Now it no longer has an official ticker symbol and most retail data providers would treat it like Robert Paulson and pretend like it never existed in the first place.
When a stock goes poof, after a while most tend to forget all about it. Since most retail data sources don’t even include these stocks, hobby traders tend to exclude them from their simulations. This will obviously make your simulations look better than what reality is likely to slap you with.
These stock tickers that for various reasons no longer exists are usually referred to as the graveyard. Including this data is important, since your strategy might very well have owned some of these stocks. The Norgate data package includes these series, which is a big plus.
Members Only
The number one mistake that hobby traders do is to disregard the survivorship bias. What? No, this is really the number one mistake. It has a much larger impact than the other points.
The classic mistake is to assume that the stocks you would trade now are the same stocks that you would have picked from ten years ago. For instance, you might start by narrowing down your stock universe to the members of an index, such as the S&P 500. But the stocks that are currently part of this index are not the same stocks that were part of the index ten years ago.
Think for a moment about why those stocks are in the index at the moment. The only reason that they are in the index is that they performed very well in the past. That’s why they became valuable enough to fit the index criteria. If your strategy involves buying stocks and you use the current index members for a ten year back test, you’re almost guaranteed to get great results. Unrealistic results, but a great looking simulation report.
A good way to solve this issue is to make sure that your simulation only considers stocks that were a part of the index on the trading day. That is, if your simulation starts in 1990, it should only be allowed to pick from stocks that were in a given index at that time. It’s a realistic way of picking stocks. But for this, you need to know when the stock was part of a given index.
Interestingly, Norgate used the same solution that I previously built for in-house use. They used the same logic and it makes perfect sense to me. What they did was to make a custom RightEdge indicator. You provide this indicator with an index code, and it will then return 0 on any days where the stock wasn’t part of that index, and 1 for any day when it was a member. This indicator obviously works for graveyard stocks as well, which is vital.
Using this indicator, it’s really easy to implement the logic. Just make sure that you don’t allow any buy orders if this indicator is 0.
If you haven’t used this method of selecting your stock universe before, you might get a little depressed when you see how much worse your result will look. It is a realistic way of modeling though, and it’s much better to get this little surprise during the simulation phase than in real live trading.
Last Quoted Date
The number one… No, this isn’t actually a common mistake. It’s actually a workaround for a RightEdge specific behavior, which can be a little tricky otherwise.
RightEdge does not allow you to see into the future. You know, much like how reality tends to be a little pesky about such things. This is generally a good thing, since it makes sure that a sloppy programmer doesn’t accidentally data snoop. I’d even go so far as to say that this is a strength of RightEdge. It simply doesn’t allow you to look at the future, no matter how much you try to.
This behavior does cause a tricky issue though. If a stock ceases to trade, for any reason you get no heads-up. So a company goes kaboom, and disappears while you have an open position. Well, your code won’t know about that until there’s suddenly no more data coming in. And you can’t very well sell a stock when there’s no price available, can you. So now you’re stuck holding the stock until the devil comes to fetch you.
The solution that Norgate made for this is again the same that I made myself for in-house use earlier. You simply use a built in function to ask for when the last quoted day is, and make sure that you sell on that day. Nicely done on that, Norgate.
Watch those Lists
The really significant modification that Norgate made to how RightEdge works is in the watchlists. They replaced the entire watch list functionality. Yes, the entire watch list functionality that you’re used to in RightEdge is gone. Instead you have an integrated and highly automated Norgate watch list system.
When you click the button to create a new watch list, you’ll see the dialog below. The data is structured and anything available is on display under the appropriate menu. You can do all kinds of searches to create a watch list, such as give me all ETFs on the NYSE with a track record longer than 5 years’ or ‘give me all stocks that were ever a member of the Russell 2000’. The absolute key point is that these watch lists are dynamic. Yes, they will change by themselves. If a new stock comes into the index for instance, that stock will now automatically be part of your dynamic watch list.
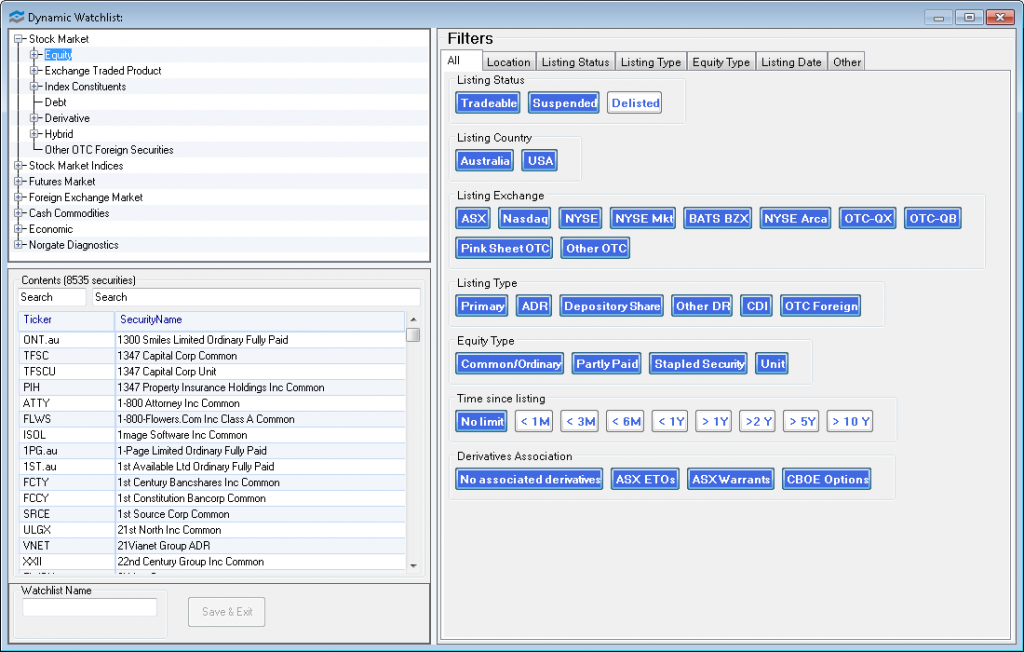
Big blue 1995 style toggle buttons? Really, Norgate?
Well, that simplifies things, doesn’t it? Adding, removing and configuring the watch lists can be a pain in RightEdge. Doing it manually in any scale is out of the question. My solution is a little custom application we built where you edit the list, which in turn writes straight to the underlying XML file. So.. the Norgate solution is probably preferable to most people, in comparison.
What about the Negative Aspects?
There’s really only one that I can think of. Since the Norgate solution is so highly integrated into RightEdge, even replacing both the watch lists and the data store, it’s very hard to combine this with any other data provider. It’s a great solution, but it’s based on being your only or at least your primary solution. That’s actually fine for most purposes and for most users. The data should cover what you need. It might be an issue with more advanced users, who combine various data providers and hook up in-house databases. But if you get that advanced, you could work around the issue anyhow.
Pricing
Pricing is low. Very low. When I wrote Stocks on the Move, I was looking around for a data source good enough for serious quant modeling, but priced in retail range. I wanted to make sure that hobby traders could replicate the research from the book without spending a fortune. The best I found at the time was QuantQuote, which has a fraction of the data coverage compared to Norgate and is priced at about 5 times as much. Still, that was the best I found for the book.
End of day updates for American stocks though Norgate will set you back about 25 bucks a month. Backfill historical data from current and delisted stocks since 1985 for a once off cost of about $300. That’s as low as you’ll get. I thought QuantQuote had good pricing before I stumbled upon Norgate.
Conclusion
I obviously like the new solution from Norgate. I’ve explained before why I prefer to use RightEdge for serious quant modeling. Weirdly, that article is actually the most popular on this entire site. It even beat my obvious click bait article on why technical analysis is stupid. Made you click, didn’t I?
Well, I still prefer RightEdge and see it as the best platform on the market at the moment. The major issue with RightEdge is the somewhat steep learning curve, especially in getting up and running with proper data. The Norgate plugin for RightEdge really solves this point, making the best simulation platform much more accessible.
Norgate has done a great job with the software integration. Their data quality is great and and the tools that they provide should let you focus on the strategies, instead of the data adapters.
We clearly have a new market leader for serious retail quant traders. RightEdge in combination with Norgate Data makes for a powerful setup and should save you considerable time and effort.


Andrew,
I am a hobby trader and recently read your book and joined your site, so a lot of GREAT info to absorb.
I am familiarizing myself with C# before I purchase RightEdge. Question specific to Futures data. Can’t I simply use my Interactive Brokers account to pull data (futures) into RightEdge for backtesting?
Thanks
Hi Brian,
You can for sure pull data from Interactive Brokers into RightEdge. I never used IB though, so I’m not sure what data is available. For futures, you’ll need properly adjusted time series, not just the individual contracts.
The most common method is to select contract based on highest open interest, and back adjust the entire series when splicing into the next contract, removing the basis gap.
I would be surprised if IB offers such adjusted futures series, but it’s not impossible. Whatever you do, stay clear of the usual dumb continuations that most data providers give you, where they just put each front contract after another without any adjustment. Those series will introduce artificial gaps at rolls, larger the steeper the curve is. And yes, that’s a huge error factor.
So yes, pulling data from IB is no issue. Just make sure that they provide the data that you need.
Andreas
Thanks for the information – sounds like great functionality and will definitely check it out. You mentioned that a drawback is that you can’t combine Norgate with other data providers. If I wanted to perform backtesting on stocks using Norgate data but continue to use CSI Data for backtesting on futures, could I do that? I’m pretty happy with CSI for futures data and they seem to cover more futures markets than Norgate.
ps: Looking forward to your article on using term structure of futures contracts to enhance systems.
Greg
So far, I’ve only used Norgate for equities data.
Combining data providers is definitely an issue in the way that this plugin is done. It’s great if you’re happy getting all your data from Norgate, but it’s not easy to combine with other sources. I’m running RightEdge on multiple computers, and one of them is using only Norgate data.
Hi Andreas,
right on regarding Norgate. I’m a user of their data in RightEdge and in other platforms. Its still got its issues but then again they are still in development/alpha. The features they provide are fantastic for the price.
I disagree with you on one thing though… Using the total return series is not always the right choice, and in some cases it is a very wrong choice. If the trading system uses any technical analysis, then the backtest is guaranteed to be wrong (not the same as in live trading). This is because the effect of a series of adjustments due to dividend payments on the price series is a non-linear compression from current to past data. In this case, reality has been distorted a posteriori, meaning that past data were changed based on future data.
Imagine you have a trading system based on momentum (uses 9-month rate-of-change to rank entry signals as an example). In live trading you get certain signals and make trades based off them. Fast forward 10-years into the future and run a backtest… The ranking and thus trades your backtest takes are different than what you executed at the time. Why? because after you took the trades the various stocks had different dividend payments and the historic price series were compressed. The ROC values from the date in the past are now different than they were in real time.
Because of this I instead simulate dividends as cash payments into the portfolio while using the non-dividend adjusted price series for signals. You may argue that you want the signals to be based on the total return. Fine. With a little more work the dividends that occurred over the look back periods can be incorporated to the signal calculation such that simulation matches actual live trading. Norgate allows you to do this.
Hi Dave,
No arguments from me there.
Using total return series is better than using just price series, but having the cash dividends payments injected is for many purposes even better. It’s a little complicated for most to implement, but it’s a solid solution.
Hi Andreas,
Clicking on the PremiumData links in the article takes one to a generic page, and for the life of me I can’t figure out how to download the plug in. Has it been taken offline?
Thanks!
Found out – the plug in is in alpha mode and hasn’t been released commercially.