It is a long established fact that a reasonably well behaved chimp throwing darts at a list of stocks can outperform most professional asset managers. While there would be obvious advantages with hiring chimps over hedge fund traders, such as lower salaries and better manners, there are also a few practical obstacles to such hiring practices. For those asset management firms unable to retain the services of a cooperative primate, a random number generator may serve as a reasonable approximation of their skills.
The fact of the matter is that even a random number generator can, and will, outperform practically all mutual funds. Such random strategies may seem like a joke, and perhaps they are, but if a joke can outperform industry professionals we have to stop and ask some hard questions.
When designing investment strategies, it can be very useful to have an understanding of random strategies, how they work and what kind of results they are likely to yield. Given that random strategies perform quite well over time, they can act as a valid benchmark. After all, if your own investment approach fails to outperform a random strategy, you may as well outsource your quant modeling to the Bronx Zoo.
I spoke on this topic at the Quantcon in New York last weekend. It was a really great event with plenty of interesting speakers. The event is organized by Quantopian and they did an excellent job with that. In my presentation, I promised to publish some source code and I will do so further down in this article. No, don’t scroll down just yet. I’ll give you a summary of what I spoke about first, and why the source code is of interest.
Portfolio Modelling
Frequent readers of my articles shouldn’t be surprised that we’re dealing with portfolio models here. A portfolio model is something very different from what most retail traders call a trading system. Oddly, the perception of trading system as a set of rules for timing buys and sells in a single market is still pervasive. That’s still what you tend to see if you ever pick up a trading magazine. That’s normally not how things look in reality of course. Not on the sharp end of the business.
What we’re normally dealing with is portfolio models. In a portfolio model, the position level is of subordinate importance. The only thing that matters is how the portfolio as a whole performs. We’ll always have many positions on, and it’s the interaction of these positions that matter in the end. Portfolio modelling is a more productive way to spend your time. It would certainly be more useful in the asset management world.
What may surprise some not in the industry is that often portfolio models don’t even bother to try any sort of entry and exit timing. Stop loss methodology is rare and concepts like position pyramding would simply never be a topic. What we’re dealing with here are usually simple models, with mechanisms for selecting components, allocating to the components, rebalancing the components and of course benchmarking the result.
Benchmarking isn’t what it used to be
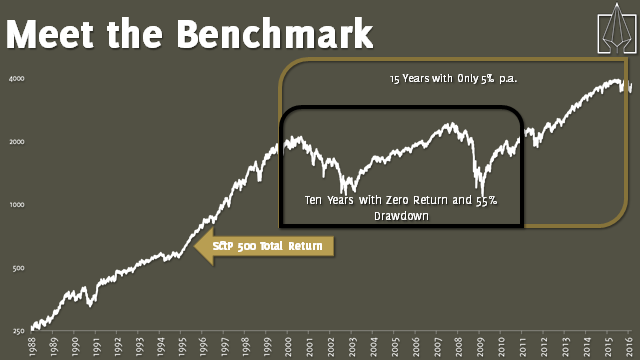
Let’s start with that last point. Benchmarking. Every portfolio has to be measured against something. Very few professionals actually have the zero line as their benchmark. That’s what hedge funds are for. If you work in the industry, odds are that you have a specific index as your benchmark. We’ll go with one of the most common benchmarks here, at least for American equities; the S&P 500 Total Return Index.
When you’ve got a benchmark index, you’re being measured against that. It doesn’t matter if you end the year +10% or -10%. It matters if you outperformed or underperformed the bench. At times it can be very comfortable to be measured relative to the index. It removes many difficult investment decisions. You gain and lose at the same time as everyone else. On the other hand, it can be frustrating when the markets are falling and you still have to be in.
The index we’re using in this article, S&P 500 TR is different from the normal S&P index that you always see quoted. This is a total return index, meaning that all dividends are reinvested. The traditional S&P index is highly misleading over time, as the dividends appear as losses. So keep in mind that the S&P TR index will always show a better performance than the regular price index over time.
Not too impressive, is it? Well, perhaps mutual funds can help.
Mutual Funds Can’t Help
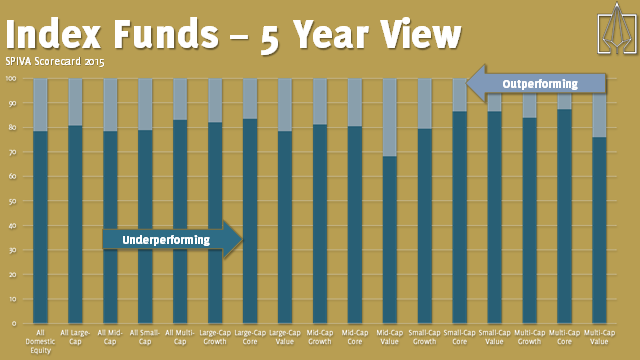
The mutual fund industry is fundamentally flawed. There’s really no reason at all to ever, for any reason buy a mutual fund. If ever the internet memes about “You had one job…” fit any industry, this would be it. The mutual funds are tasked with tracking and outperforming an index. On average, around 85% of all mutual funds fail. How do I know that? The freaking SPIVA reports.
How can the Chimps Help?
Professor Burton Malkiel once famously wrote in A Random Walk Down Wall Street that
A blindfolded monkey throwing darts at a newspaper’s financial pages could select a portfolio that would do just as well as one carefully selected by experts.
Now I think that’s highly unfair. After all, why would we want to blindfold the monkey? In what way would that contribute?
As we all know, academic research has to be confirmed by empirical observation to be of much use. Ladies and gentlemen, I give you Ola the Ape.
Back in early 90 when I was in business school in Sweden, we had a highly prestigious national investment championship. This was normally won by the famous analysts at the big investment banks. This was quite a big deal and getting a high ranking in this competition was a big career move. Then in 1993, somehow a chimp from the local Stockholm zoo got entered into the competition. Ola the Ape threw actual darts at the actual stock listings of the newspaper to pick his stocks. And he won.
Random Simulations
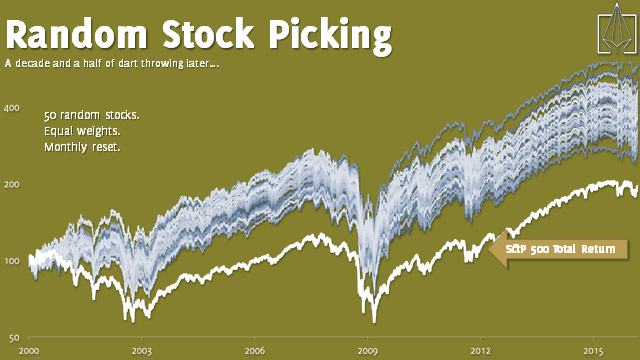
Unfortunately, our office chimp Mr. Bubbles has just accepted a higher offer from a competing firm, so I will have to resort to random number generators to prove this point. The first strategy we’ll test is something you’ve probably seen elsewhere. But we have to start somewhere. Here are the rules:
- We only pick stocks from the S&P 500 index. Historical membership accounted for of course.
- At the start of each month, we liquidate the portfolio and buy random stocks.
- We buy 50 random stocks for each new month.
- Each position is given an equal cash weight.
Not too bad, is it? Not a single monkey failed to beat the index. But what’s going on here? Surely there’s a trick here? Let’s push this concept a little further and see if it falls apart.
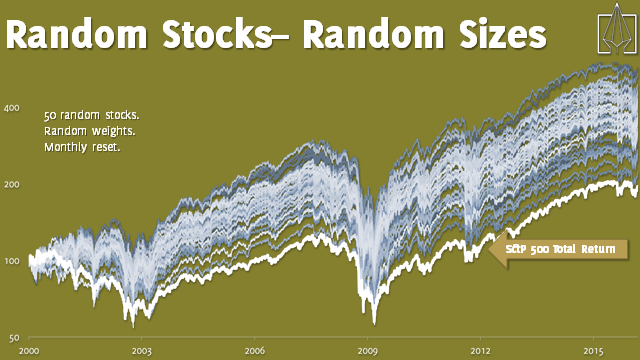
Our next simulation is even randomer. Yes, I’m sure that’s a word. The previous simulation had equal weighted position allocation. Perhaps that’s the trick. But would a monkey really allocate an equal amount to each stock? Or would he pick that at random too?
Here’s our next simulation:
- We only pick stocks from the S&P 500 index. Historical membership accounted for of course.
- At the start of each month, we liquidate the portfolio and buy random stocks.
- We buy 50 random stocks for each new month.
- Each position is given a totally random allocation.
Yes, we’re allowing any position sizes here. Perhaps a position is 0.0001% or perhaps it’s 99.99%. Let’s go wild.
Ok, this is getting ridiculous. We’re still clearly outperforming the market. Not a single monkey loses against the index. Sure, there’s a lot wider spread here and that’s to be expected. There’s quite a large difference between the best monkey and the worst one, but they’re all better than the index and certainly better than the mutual funds.
So where’s the trick? Is it the 50 stocks? Could this whole thing have to do with the magical number 50? After all, isn’t this a Fibonacci number? And why would a monkey pick this number of stocks anyhow? Fine, let’s relax this one as well. Let’s do another one.
- We only pick stocks from the S&P 500 index. Historical membership accounted for of course.
- At the start of each month, we liquidate the portfolio and buy random stocks.
- We buy a random number of random stocks for each new month.
- Each position is given a totally random allocation.
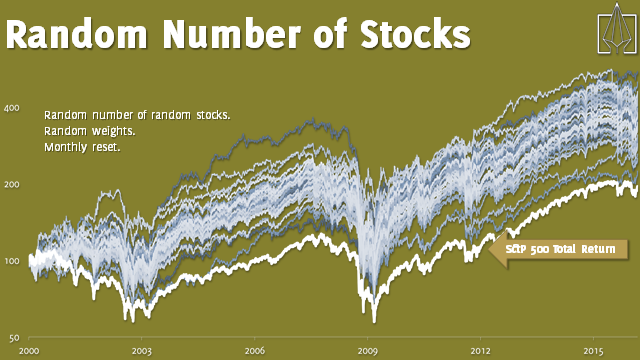
A random number of random stocks at random allocations. Now that’s how a proper monkey trades. Will the monkeys finally lose this time?
No. The monkeys still win. Now we see some really wild swings, but in the end our primate friends persevere. But now it’s really getting silly, isn’t it. What are we doing here that’s clearly working?
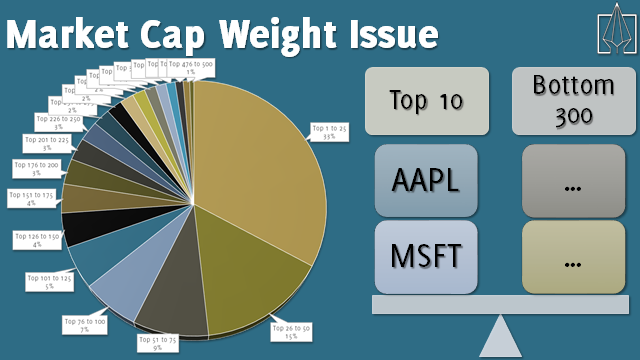
Actually, it’s the other way around. The single largest positive factor is that we avoid making a mistake. That mistake being market capitalization weights. Simply by avoiding market cap weighting, we outperform. The larger issue here is benchmarking against an equal weighted index, such as the S&P 500.
We all know that there are (approximately) 500 stocks in the S&P 500. But is that really true? Did you know that the top 10 stocks in that index has an approximate weight of 18%? And that the bottom 300 stocks also have a combined weight of about 18%? We’re all pretending that the S&P 500 is a diversified index, but it’s really not. It’s tracking a handful of the largest companies in the world and the rest really don’t matter.
To be fair to the index, and the index providers, I’d have to point out that indexes were not originally meant to be investment strategies. They were meant to measure the health of a market. As such, they’re not all that bad. But that doesn’t mean that you should invest like the index.
It’s easy to check out equal weighting performs against market cap weighting. Just compare the S&P 500 Equal Weighted Total Return Index with the S&P 500 Total Return Index. Same stocks, same index provider, same methodology. Easy.
In the random simulations above, we’ve seen that both equal weights and random weights are better than market capitalization weights. Obviously only a chimp would use random weights. Equal weights are quite common, though in my own opinion it makes much more sense to use volatility parity weights. That’s no where near as complicated as it sounds.
Vola parity just means that we size our positions according to inverse volatility. A more volatile stock gets a smaller allocation. Why? Because if you put an equal amount of cash in each stock, your portfolio will be driven by the most volatile stocks. If you buy a utility stock and a biotech, the biotech stock is likely to be the profit and loss driver of the portfolio. An equal weight in the two would mean that you put on more risk in one stock that the other. Vola parity weighting means that you, in theory, put on equal amount of risk in both stocks. Yes, I deliberately used the word risk here so the comment field will be filled up with quants pointing out that I don’t understand risk. Go ahead. I’ll wait.
Let’s do one more of these funny simulations before getting to the real stuff.
- We only pick stocks from the S&P 500 index. Historical membership accounted for of course.
- At the start of each month, we liquidate the portfolio and buy random stocks.
- We buy 50 random stocks for each new month.
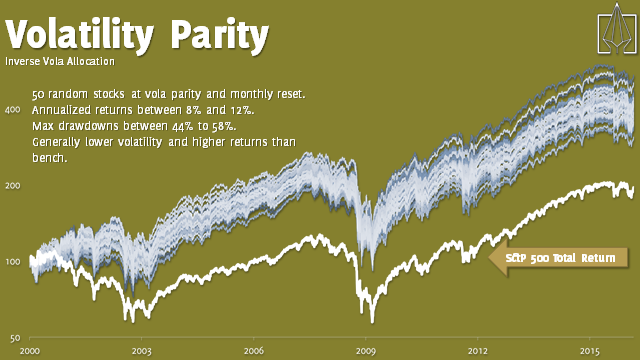
- Each position is given a volatility parity allocation.
This looks pretty good, doesn’t it? Now we have better performance and more importantly, a narrower span of performance. The monkeys all do really well and there’s not all that much difference between them. If only we could figure out a way to be one of those better chimps.
Let’s be the better primate!
Why should the chimps get all the fun? Clearly these guys know how to trade, but perhaps we can figure out a way to beat them. We’ll have to take out the random factor and find a better way to pick our stocks. The volatility parity seems to work though, and so does the monthly rebalancing. We’ll keep those.
There are several valid ways of picking stocks. You could use value factors, dividend yield, quality, momentum etc. I’m going to use momentum here, because clearly it’s the best one (not at all because I wrote a really neat book on that topic). Besides, it’s the easiest one to quantify and model. The data is more readily available and so are the tools needed.
Here’s our new, chimp free simulation:
- We only pick stocks from the S&P 500 index. Historical membership accounted for of course.
- Trading is done monthly only.
- Rank stocks based on Clenow Momentum™.
- If cash is available at start of month, buy from top of ranking list until no more cash.
- Inverse vola position sizing, using ATR20.
- Sell at start of month if stock is no longer in top 20% of index or if Clenow Momentum™ is lower than 30.
Some may recognize this as a simplified version of the one presented in Stocks on the Move. It’s much simpler, but performs in a very similar manner. It has slightly deeper drawdowns and slightly higher return.
Those of you who didn’t read Stocks on the Move, may wonder what a Clenow Momentum is, and whether or not I’m joking about that name.
The Clenow Momentum™ is clearly a silly name for a pretty decent analytic. This is just an improved way of measuring momentum. First we take the exponential regression slope, instead of the linear, since it’s measured in percent and can therefore be compared across stocks. It will tell us the slope in percent per day, which will give you a number with too many decimals to keep track of. So we annualize it get a number that we can relate to. Now the number tells us how many percent per year the stock would do, should it continue the same trajectory.
But the annualized exponential regression slope doesn’t say anything about how well the data fits the line. The coefficient of determination, R2, does. That’s a number between 0 and 1, where a higher value means a better fit. If we multiply the two, we essentially punish stocks with high volatility. And there you go. Clenow Momentum™!
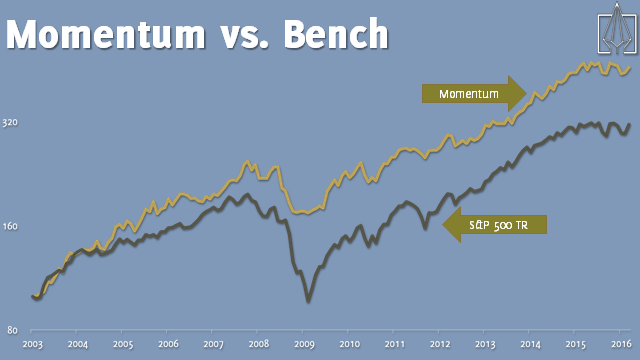
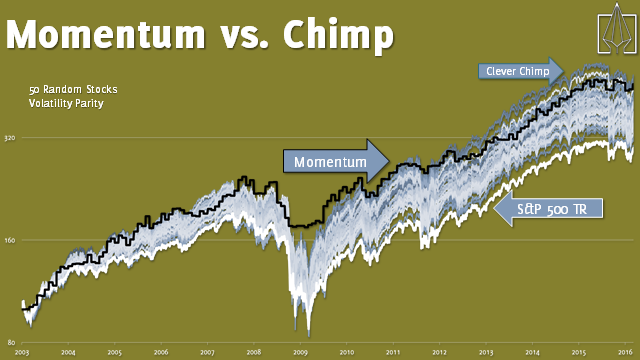
Now we’re seeing some interesting results! Even without the help of the chimps, we’re now clearly outperforming the bench. It’s a consistent outperformance too, during both up and down markets. The reason that we outperform in bear markets is that we don’t buy stocks with a low absolute momentum value. When there are no stocks moving up, we don’t buy any.
This all seems good and well, but I’m sure you’re all wondering about the most important point. How did we do against the chimps?
We may not be the best primate, but we’re certainly among the smarter ones! Being in the upper 5% of the chimps is pretty good. On the evolutionary scale, we have now moved beyond the mutual fund managers, beyond the index itself and we’re competing with the best of the chimps!
So what’s the point here?
There are several important learning lessons from all of this. Perhaps the best way to summarize it would be to paraphrase Gordon Gekko:
The point, ladies and gentlemen, is that chimps are good.
Chimps are right.
Chimps work.
Chimps clarify, cut through and capture the essence of the evolutionary spirit.
Well, with all due respect to Gekko the Great, perhaps there are better ways to sum this up.
- Random models reveal the weakness of index construction.
- Benchmarking against random models help you put your own results into context.
- Does your portfolio model really add value, or is it just another chimp?
- It’s very easy to make a simulation that beats the index.
- You will never beat all the chimps.
Quantopian Source Code
Fine, I guess I promised you source code to trick you into reading my long article of bad monkey jokes. I’m not an expert on Quantopian or Python so I got some great help from James Christopher at Quantopian on this. This code is tested and works fine, but I’m leaving absolutely no guarantees and certainly no support. Learn from it, modify it and make it your own. If you have no quant environment of your own, Quantopian is a great place to start modelling without the need for a costly and time consuming effort of setting up a local environment.
The below code is built to run in minute level simulations.
|
1 2 3 4 5 6 7 8 9 10 11 12 13 14 15 16 17 18 19 20 21 22 23 24 25 26 27 28 29 30 31 32 33 34 35 36 37 38 39 40 41 42 43 44 45 46 47 48 49 50 51 52 53 54 55 56 57 58 59 60 61 62 63 64 65 66 67 68 69 70 71 72 73 74 75 76 77 78 79 80 81 82 83 84 85 86 87 88 89 90 91 92 93 94 95 96 97 98 99 100 101 102 103 104 105 106 107 108 109 110 111 112 113 114 115 116 117 118 119 120 121 122 123 124 125 126 127 128 129 130 131 132 133 134 135 136 137 138 139 140 141 142 143 144 145 146 147 148 149 150 151 152 153 154 |
from quantopian.algorithm import attach_pipeline, pipeline_output from quantopian.pipeline import Pipeline from quantopian.pipeline.factors import CustomFactor, SimpleMovingAverage, Latest from quantopian.pipeline.data.builtin import USEquityPricing from quantopian.pipeline.data import morningstar import numpy as np import pandas as pd from scipy import stats import talib def _slope(ts): x = np.arange(len(ts)) slope, intercept, r_value, p_value, std_err = stats.linregress(x, ts) # annualized_slope = np.power(np.exp(slope), 250) annualized_slope = (1 + slope)**250 return annualized_slope * (r_value ** 2) class MarketCap(CustomFactor): inputs = [USEquityPricing.close, morningstar.valuation.shares_outstanding] window_length = 1 def compute(self, today, assets, out, close, shares): out[:] = close[-1] * shares[-1] def make_pipeline(sma_window_length, market_cap_limit): pipe = Pipeline() # Now only stocks in the top N largest companies by market cap market_cap = MarketCap() top_N_market_cap = market_cap.top(market_cap_limit) #Other filters to make sure we are getting a clean universe is_primary_share = morningstar.share_class_reference.is_primary_share.latest is_not_adr = ~morningstar.share_class_reference.is_depositary_receipt.latest # TREND FITLER ON # We don't want to trade stocks that are below their 100 day moving average price. # latest_price = USEquityPricing.close.latest # sma = SimpleMovingAverage(inputs=[USEquityPricing.close], window_length=sma_window_length) # above_sma = (latest_price > sma) # initial_screen = (above_sma & top_N_market_cap & is_primary_share & is_not_adr) # TREND FITLER OFF initial_screen = (top_N_market_cap & is_primary_share & is_not_adr) pipe.add(market_cap, "market_cap") pipe.set_screen(initial_screen) return pipe def before_trading_start(context, data): context.selected_universe = pipeline_output('screen') update_universe(context.selected_universe.index) def initialize(context): context.market = sid(8554) context.market_window = 200 context.atr_window = 20 context.talib_window = context.atr_window + 5 context.risk_factor = 0.001 context.sma_window_length = 100 context.momentum_window_length = 90 context.market_cap_limit = 500 context.rank_table_percentile = .2 context.significant_position_difference = 0.1 context.min_momentum = 0.30 attach_pipeline(make_pipeline(context.sma_window_length, context.market_cap_limit), 'screen') # Schedule my rebalance function schedule_function(rebalance, date_rules.month_start(), time_rules.market_open(hours=1)) # Cancel all open orders at the end of each day. schedule_function(cancel_open_orders, date_rules.every_day(), time_rules.market_close()) def cancel_open_orders(context, data): open_orders = get_open_orders() for security in open_orders: for order in open_orders[security]: cancel_order(order) #record(lever=context.account.leverage, record(exposure=context.account.leverage) def handle_data(context, data): pass def rebalance(context, data): highs = history(context.talib_window, "1d", "high") lows = history(context.talib_window, "1d", "low") closes = history(context.market_window, "1d", "price") estimated_cash_balance = context.portfolio.cash slopes = np.log(closes[context.selected_universe.index].tail(context.momentum_window_length)).apply(_slope) print slopes.order(ascending=False).head(10) slopes = slopes[slopes > context.min_momentum] ranking_table = slopes[slopes > slopes.quantile(1 - context.rank_table_percentile)].order(ascending=False) # close positions that are no longer in the top of the ranking table positions = context.portfolio.positions for security in positions: price = data[security].price position_size = positions[security].amount if security in data and security not in ranking_table.index: order_target(security, 0, style=LimitOrder(price)) estimated_cash_balance += price * position_size elif security in data: new_position_size = get_position_size(context, highs[security], lows[security], closes[security]) if significant_change_in_position_size(context, new_position_size, position_size): estimated_cost = price * (new_position_size - position_size) order_target(security, new_position_size, style=LimitOrder(price)) estimated_cash_balance -= estimated_cost market_history = closes[context.market] current_market_price = market_history[-1] average_market_price = market_history.mean() # Add new positions. #if current_market_price > average_market_price: ############ ac disabled market filter if 1 > 0: # dummy for security in ranking_table.index: if security in data and security not in context.portfolio.positions: new_position_size = get_position_size(context, highs[security], lows[security], closes[security]) estimated_cost = data[security].price * new_position_size if estimated_cash_balance > estimated_cost: order_target(security, new_position_size, style=LimitOrder(data[security].price)) estimated_cash_balance -= estimated_cost def get_position_size(context, highs, lows, closes): average_true_range = talib.ATR(highs.ffill().dropna().tail(context.talib_window), lows.ffill().dropna().tail(context.talib_window), closes.ffill().dropna().tail(context.talib_window), context.atr_window)[-1] # [-1] gets the last value, as all talib methods are rolling calculations# return (context.portfolio.portfolio_value * context.risk_factor) / average_true_range def significant_change_in_position_size(context, new_position_size, old_position_size): return np.abs((new_position_size - old_position_size) / old_position_size) > context.significant_position_difference |
 Following the Trend







Dear Andreas, it would be interesting to see a trend follower chimp! We always keep the random process but only when the S&P 500 is above its 12 month moving average. When the SP is below then we just keep cash (or other form of safe investments). Just a suggestion.
Please compare SPY with RSP and recalculate!
I didn’t compare the ETFs. I compared the total return indexes. Would you care to explain where you think the problem is?
I do enjoy your posts and your humor. I only wish they were more frequent! 🙂
Andreas,
Thank you for elevating our kind to deserved heights. Keep the bananas.
Mr. Bubbles? Is that you? Please come back! All is forgiven!
Very nice post of you, Andreas
Have you testes, just out of curiosity, how it would go of you had a long AND short portfolio, using the same approach?
Best Regards
Here’s a video you should use in your presentation. It very nicely illustrates your point!
https://twitter.com/AwardsDarwin/status/718408171325366272
The _slope function seems to use a timeseries of close prices, but shouldn’t that be based on a timeseries of logreturns?
It should indeed be on logreturns. I didn’t write the Quantopian code, and since I don’t know much about Python and the Quantopian libraries I haven’t done much more testing than to establish that the results are close enough to what I get locally.
If you’d like to contribute a fixed version, I’ll publish that and credit you.
Are you factoring in transaction costs?
If you trade only 25 stocks every month at a cost of 10bps per stock (fee+bid ask spread) the yearly cost of rebalancing the portfolio is 12x25x10/50=60bps per annum. This is not unreasonable, but just curious if factored in the results presented here.
I did factor in transaction costs, but to be perfectly honest I didn’t exactly make very harsh assumptions. After all, we’re just having fun here. 🙂
It works with higher transactions costs as well, and you’ll arrive at the same conclusions, though with a little lower lines.
Of course, you could also make an argument for that this analysis shouldn’t have transaction costs at all. It depends on what we’re comparing here. If we’re comparing index approach versus monkey approach, there shouldn’t be any transaction costs, since the index doesn’t have them. Yes, it’s a stretch, but you see what I mean…
Good point. While reading the latest book I thought of the same. The stock selection model trades -even more frequently – on a weekly basis and rebalances bi-weekly
For the book model, if you’re subject to high transaction costs or to capital gains taxes, trade monthly.
I have to write up an article on that topic soon. It’s something I regret about the book. I wrote it from my own perspective, of having very low transaction costs and no capital gains taxes. Fund managers don’t have any capital gains taxes, and we don’t really have them here in Switzerland anyhow, at least not the way that most countries do.
For most readers, it would make more sense to trade monthly to lower transaction costs and tax.
I’ll get back to you via direct email, Paul. For regulatory reasons, I’m very careful never to discuss investment products in public forums. The public distribution rules are getting very strict and I want to make sure that this website is not seen as a marketing tool for hedge funds, which would be something that regulators might take issue with.
This really hits home as I have been studying strategies, some offered up by others as $4000 per year software programs that implement momentum as straight-forward ranking and one added volatility as a rank weight factor for stocks (where it was claimed not to work well for ETF asset-allocations).
Having had bad luck paying up for software trading programs that get me trading a lot only to find all the performance eaten up in excessive trading, this shines brightly as the light leading out of the darkness.
Thank you Andreas!
I have never come across anyone selling trading systems who actually knows anything about the subject. There might be some, but I’ve never seen them.
As a general rule, if someone is selling trading systems, they have no idea what they’re talking about. It’s a shady, unethical business populated by people who make up nonsense backstories about their own success and then sell some ridiculous overfitted system to unsuspecting hobby traders.
Hell, I’ve even seen a few websites out there selling the exact rules from my books, claiming that they’ve spent years developing them. I contacted one of these frauds recently. His website was created in July 2015, right after my last book came out. On the site he uses terminology and quotes straight from my book, but claims that he’s spent many years and tens of thousands of dollars developing the rules. And of course, now he’s selling it to anyone dumb enough to buy it from him for a thousand bucks, instead of buying my book for $38.
And what does this master trader do for a living? He works in the human resource department of some Canadian energy company.
There are probably exceptions to the rule of system sellers being frauds, but I have yet to come across one.
I was just curious why the Momentum with risk parity weighting chart started in 2003, when the previous volatility parity chart for chimps included the ’00-’03 bear market. Could you show an extended chart including that period?
Oh, that’s true. Forgot to mention that in the article.
I made all these charts and slides for the QuantCon presentation, and there are two reasons for starting the last ones at 2003.
First, a huge chunk of large cap underperformance comes from 2000-2003, when the huge dot com stocks went kaboom. Excluding this period makes the comparison more fair (and including it makes my first charts look so much more shocking).
Second, since Quantopian were paying to have me at their event, I wanted to be nice and use their data for the final slides, and their data starts at 2003.
Hello Andreas,
Thank you for posting this, I enjoyed the presentation you gave at Quantcon. I was watching the livestream. I have posted a question for you on the Quantopian thread where you made this code available. In my testing I found the results were affected by a small change to the MarketCap function. If you have time I would appreciate it if you popped over and took a look. I was hoping you could help point me in the right direction as I try to test what is contributing to those results.
I also posted an updated version of the algorithm there which has been changed to work with the new “Q2” version of Quantopian. The updates they made are actually quite nice, the backtest of this system runs much faster now.
Looking forward to the update from you taking the position of a retail trader. I agree, that monthly or even quarterly re balancing might be better. Maybe one should only rebalance once a month or Q but action must be taken on any stock closing below it’s 100day ema immediately, rather than just falling out of the top 50 etc.
This article really is flawed in my opinion. First of all, a log scale should be used to highlight continuing performance. This graph is literally framed perfectly to make his incorrect argument. If you go back to 1990 to 2000, SPY out performs an equal-weighted index. Also there has been an article written on this showing that their is no free lunch here. The equal-weight index purely offers higher returns because you take more risk by having larger positions in smaller cap stocks relative to the top 100 huge ones that make up the S&P 500. Lastly, its clear that the momentum factor stopped working as far back as 2006 perhaps, you cant tell without posting return/risk numbers and showing a log scale. Basically just another author trying to sell his book.
Yes, brilliant research there. Ok, let’s take this from the start.
1. This article is a bit of fun and not an academic paper. Relax, angry anonymous comment trolls.
2. Since 1990, 100 dollars in the SPXEWTR would now be worth 1,517 dollars. The same in the SPXTR would be worth 1,018. Check your numbers. There were a few years where large caps outperformed, but over time they have lost big.
3. Oh, a paper has been published that says there are no free lunches? Ground breaking news, really. Thank you so much for pointing this out.
4. Equal weighted index offers higher returns because more risk is allocated to smaller companies? Good. so you did read the article after all.
5. Momentum factor stopped working in 2006? According to what? The MSCI USA Momentum has yielded a return of 43% since 2013 while the MSCI USA index showed a return of 31%.
6. Selling books does not exactly pay any bills. The revenues from book sales are so tiny that it would make absolutely no sense to push false research for selling a few more.
7. I’m getting a bit sick of the increasing amount of internet trolls who can’t be bothered doing any sort of research, and just want to post negative nonsense and pretend to be smart online. Also, using the name Sean in the name field when your email address clearly shows that your name is Miles doesn’t look too good. Had you asked a little more politely, I would have explained the topic, but frankly I can’t be bothered at this point.
I wouldn’t take it personally Andreas – the internet is full of people who try to belittle other peoples work, even if the work was clearly just there for a little bit of fun and to get readers thinking a little more or differently.
I enjoyed the article at least. The weighting part of the index does remind me of an article I read a while back about a fund manager who has been able to outperform the indexes by a decade, and his portfolio only comprises of 5-10 stocks or so. I am still amazed by how many people I meet that just buy ETFs for Indexes simply because they think it is “diversified” and less “risky”, even though the asset class for the ETFs are all shares … bonkers.
Andreas,
How can a retail guy follow a simple momentum system? Any good etfs?
Or can we subscribe to your momentum report and just trade the 25 best tickers or so and still mitigate risk? My thinking is its impractical to manually trade any system that ranks 50 to 500 stocks.
Note: I’m looking at doing this in a taxable account, so would monthly trading make sense?
I’m planning to do an article on the ETF space soon. I’ll get back to you on that one.
Or you could trade it yourself of course, using the data from this site or calculating it yourself.
Hi Andreas,
What do you think of investing into the iShares Edge MSCI USA Momentum ETF which basically tracks the MSCI USA Momentum Index?
I see that the iShares ETF ideal as they are cash based etf with low expense fees and has quite good trading volumes suitable for retail investor.
Suitable for one who does not want or have the tools to do calculation and rebalancing etc. Perhaps, a trend filter to buy the ETF only when SPX is above 200day moving average and sell it goes below.
The MSCI USA Momentum ETF is interesting, though it has a design feature that I don’t like.
The underlying index ranks stocks on vola adjusted momentum and picks the best ones. So far so good. They use a different analytic than I do, but no issues there.
Then they use the ranking score (winsorized z-scores) and multiply by market cap for weighting.
It all makes sense if you’re expecting very large capital invested according to the methodology. If you’re MSCI, you kinda need to use market cap for weighting or you’ll have issues with investability in the end. I would prefer not to use market cap as a weighting factor though.
It also buys negative momentum stocks. If all or most stocks are falling, like in 2008, the index will pick the stocks that have the lowest negative momentum.
tl;dr The ETF is good, but it can be done better.
Thank you for your inputs. Really appreciate your thoughts on this.
Hi Andreas, your articles are really educating. One thing I want to mention here is that volatility based risking has a problem, from my observation short term volatility like 20day-ATR and such is not constant for a given instrument, often volatility also changes with time in that case system should adjust positions for new volatility, this is expensive, especially for a small account and simple traders. I think its better to take the worst volatility in 200days for risking, and even that can change. But, it accepts worst that happened. Request your thoughts
Absolutely right, no arguments from me there. Blog articles need to be simplified and you can’t, and probably don’t want to, cover everything.
I’d say that even a simplistic vola model is better than market cap or equal weighted, but of course not a perfect solution. One step at a time though. 🙂
A simple but improved model would be to use a short term vola measurement but use a long term stress scenario for capping sizes, which is probably just what you had in mind as well.
Hi Andreas –
Now that we have not just one index, but half a dozen, from which to select the highest ranking stocks (that pass all filters of course), would it be feasible to select, say, the top three to four ranking stocks from each to build one’s portfolio? Or maybe just take the top 20 or so with the highest adjusted slope values (again, that pass all filters)?
Best,
Ken (Orig Guinea Pig)
Hey Ken,
I guess you could, but why not just use a broader index? Pick from the SP 1500 for instance, instead of SP500, SP600 and SP400.
Hi Andreas –
Makes sense! Occasionally, a NASDAQ stock might make it up the slippery slope, so I’ll probably check that one too.
Since I use a brokerage that allows the purchase of fractional shares of up to 30 stocks (regardless of portfolio size), I’m able to buy the top 30 ranked stocks that have passed all filters. Those weightings, however, add up to a total weighting of only 86.84. So, I figure I’ll just divvy up the balance (13.16) and distribute that (in this case, .4) to the individual target weights of each of the 30 stocks. I’m too lazy to figure out the distribution proportionate to target weight.
Or maybe with the 13.16 I could buy an ETF for the sector that has the most representation on the list (today it’s energy with 14)? Tell me how stoopid that would be.
Or should I top off at 20 stocks as you suggest and distribute the difference to those 20?
Oh, if I’m using S&P1500, is it still the 200dsma on the .SPX to determine market regime, or should I be watching the chart for the S&P1500?
Danke shoen!
Ken
cheers for the article Andreas.
Lets say a UK or European asset management company wants to follow the S&P instead of FTSE or some other european index; what is the best way to hedge currency exposure from trading US stocks if your fund is GBP based?
Maybe by buying a currency futures contract and then liquidating the positions every month, then buying more or less contracts depending on the P/L?
or is there some better way?
Forwards would be easier, Paulius.
Cheers Andreas,
But with any strategy there is a risk that the strategy may be in a draw-down. So once the delivery date comes from an fx forward and you convert below the agreed amount; aren’t there any penalties?
Just take an offsetting trade to reduce the hedge if needed.
Keep in mind that currency hedging can be quite expensive. This year we’ve seen some pretty wide spreads in the Sterling forwards markets, after the sudden vola expansion.
The main practical issue with using futures for currency hedging is the daily mark to market. You’ll get pnl flows on a daily basis, which is probably not what you want.
Hi Andreas,
Thank you for this informative as well as fun article!!
How can we apply this model to Equity Futures to get the benefits of leverage? Assuming that we do the allocation as a percentage of total margin base instead of total capital. We may need a much larger capital base for the variable allocation to make sense and we may have larger drawdowns because it is all a beta bet. But essentially, can the same principle be applied to buying Equity Futures instead of the underlying Stock itself? Or do we need to take care of anything else?
Thanks & Regards,
Ishwar.