Managing a momentum equity portfolio requires some analytical data. You need to keep track of momentum rankings, volatility, trends etc. Some people have no problem building programs to calculate these on their own, while others don’t have the know-how or simply lack the time to do it themselves. For this reason, I’ve added this premium equity momentum section. It’s unlikely that anyone would subscribe to this report without having read Stocks on the Move, so I won’t repeat all the same things again here. What I will do is to try to explain how to work with the data presented to construct your own portfolio.
The Ranking Table
The ranking table is the key tool. Don’t make the mistake of thinking that the portfolio screen is more important. You need the ranking screen, and you can manage your momentum portfolio using only this screen. First we’ll take a look at the fields provided and then go into the workflow for managing your portfolio.
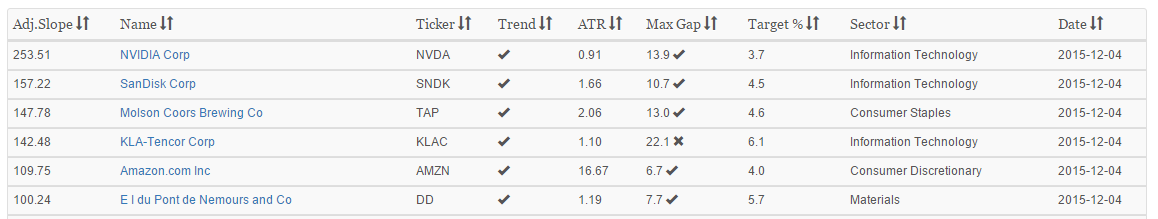
The first column is the adjusted slope. Conceptually, this tells you how strong the stock is. The absolute slope of the stock is adjusted for its volatility, rewarding stocks that move up smoothly over those that are choppy. For those are interested in the details, the actual calculation is just a 90 day exponential regression, annualized and multiplied by the coefficient of determination. No, it’s not important to understand those words but it doesn’t hurt if you do.
Skipping the obvious columns Name and Ticker, we’ll move to Trend. Using a simple but robust approach, we a positive stock trend as having current price higher than a 100 day moving average. If this is the case, you’ll see a check mark in this column, else a cross.
The ATR column shows a 20 day ATR reading. It’s a simple way to estimate volatility and can be used for various risk related calculations.
Max Gap tells you the largest close to close gap seen in the past 90 days. Gaps make me nervous and I like to keep track of how large a move a stock has seen in the recent past. If it’s seen a larger gap than 15%, you’ll see an x here, else a check mark.
Target% uses the position sizing formula from Stocks on the Move and shows you how large of a position size that formula would come up with. The more volatile a stock is, the lower the position size. The idea is to allocate equal risk.
Finally, you get a column with sector information as well as a field showing when the last update was made.
Also, don’t forget about that Download button at the top.
Workflow
When you built your initial portfolio, start from the top of the ranking list. Those are your top candidates. Except of course if there’s an x on any field, if for instance the stock is in a negative trend or has too high gap.
The standard way to build your portfolio would be to just start buying from the top of the list, at the weights indicated. In reality, you might want to look at each stock first and make sure that you’re comfortable with it.
Remember that this sort of trading model is about the broad concept. If it would be sensitive to your exact stock selection, it wouldn’t be a robust model in the first place. As long as you pick highly ranked stocks, it doesn’t matter if you pick stock X or stock Y. It might matter in the short run, but a model like this is based on the concept, not the details. It will even out.
So you buy a portfolio based on top stocks, and buy until you’re out of cash. Provided of course that the index is favorable. Remember that we need the index, in this case the S&P 500, to be trading above its 200 day moving average.
Rebalancing Frequency
Now you need to decide how often you want to rebalance. In the book, I do a weekly rebalance of the portfolio and a bi-weekly rebalance of position sizes. In retrospect, perhaps that wasn’t the best choice and you may want to wait longer between rebalancing.
I come from the institutional side. When you’re managing funds and similar, you don’t have to worry about capital gains taxes. Even for private investments, we don’t have capital gains taxes where I live. The thought didn’t really occur to me when I wrote Stocks on the Move. If you’re living in a world with no capital gains taxes and very, very low transaction costs, then the weekly rebalance is just fine. What I’ve come to realize though is that most of you guys subscribing to this report are very much affected by such adverse factors. No worries, the solution is simple. Let’s rebalance monthly, for both the portfolio and position level.
How to Rebalance
Excel is your friend. Start by downloading the latest ranking table and open it in Excel. Actually, a really great alternative is Google Sheets, and I’ll have to write a separate article on that soon. Now compare your actual positions with the ranking table. Look up the stocks you’re currently holding and start by checking for any stocks that should be sold. If the stock isn’t in the top 100, sell it. If the stock isn’t trading above its 100 day moving average, as indicated in the trend column, sell it.
Now check the stocks you’re going to keep, and see how large difference there is between your weight and the target weight. Weight is simply the percentage value of your stock in relation to your total portfolio. The total portfolio includes all cash holdings as well. Don’t bother with tiny differences. If you’re holding 4.5% of a stock and the target weight is 4.8%, then just ignore it. This is not an exact science anyhow, just a way to make sure that your positions are roughly at vola parity. Adjust where it needs to be adjusted, sell or buy to approximately match the target weights.
Last step is to check if you’ve got cash on your hands. Perhaps you sold some stocks or perhaps the rebalancing left you with cash on the books. If the index is positive, you should now buy new stocks for your spare cash. Start at the top of the ranking list, pick stocks that are high up but not yet owned, buy at the target weight until you run out of cash.
Portfolio Monitoring
Making a portfolio monitoring sheet is a good idea. That means building a portfolio management screen, automatically calculating the value of your positions and portfolio. There are a few ways of doing this, and this article is probably not the best place to explain it. I would recommend getting Xenith if you want a great solution and don’t mind paying around ~100 USD a month for it. In my view, this is the very best solution available for retail traders. It’s the same as Reuters Eikon, which normally sells for $2000/month, but MetaStock has licensed and rebranded it for the retail market. It’s an amazing bargain in my view.
If you don’t want to spend money on it, and just want something very simple anyhow, use Google Sheets. I’ll write an article later on to guide you on how to set up a portfolio monitoring screen in either of these environments.
Questions?
If something is not clear, please send me a mail. If something is not clear to you, then it’s probably the same for others. I’ll update this article with relevant information based on your questions. If there are more features you’d like to see, please send them to me as well. Often it’s quite easy to add new tools to the site.