 Traders and investors often use leverage as a crude risk measure. It’s an easy way to relate to how much you’re risking. If you have a portfolio worth $100,000 and you borrow to buy $150,000 worth of IBM, you’ve 1.5 times leverage. As simple and intuitive that this approach is, it’s also dangerous and can lead to flawed investment decisions.
Even professionals make this mistake
Ok, so you made up your mind to buy AAPL. How much are you going to buy? How do you decide? Surprisingly many people, even professional asset managers, will tell you that they have a default exposure. They might have a rule where they normally take a 5% position for instance. With 5% position sizes, you can buy 20 stocks before you run out of cash so it makes for a reasonable portfolio approach, one might think. If the asset manager sees a stock as a little more risky or if he has less conviction, he might take a half unit of 2.5% instead. That’s how surprisingly many people approach position sizes and the risk that’s implied by it.
You’ll notice the same mentality on market television. A commentator might remark that a hedge fund was 10 times leveraged, implying that they were taking crazy amounts of risk. The reality is that this number really doesn’t mean anything. Having a 10 times leverage might be high risk, but it might also be a low risk. The leverage alone is not enough to indicate anything about risk.
Leverage does not equal risk
Leverage tells you how much notional exposure you have in relation to your total capital. You buy $120,000 worth of GOOG on a $100,000 portfolio, buying on margin. You would then have a 1.2 times leverage and a 120% exposure to Google. If you trade futures, its even easier to take on larger exposure since you only need a small amount of initial margin. The mini S&P futures, SP, requires a margin of around $5,000 per contract. On the same $100,000 account, you could buy 20 of those for a total exposure of around #1,840,000 and thereby a leverage of 18 times.
Naturally, buying almost two million worth of the S&P 500 index on a $100,000 portfolio is quite risky. You could also say that it’s twice as risky to buy 20 contracts compared to buying 10. So far the leverage logic holds up. But as soon as you introduce more than one asset, it breaks down fast.
Single asset class scenario
Let’s look at a single asset portfolio first. Even for a portfolio of just stocks, you can see the problem. The stock portfolio in the table below is created to illustrate the effect. The stocks themselves are randomly selected and the prices are not current. This is to demo an effect, and constitutes no recommendation for or against any of the portfolio holdings.
There are 20 stocks in total and they’ve all been allocated an exposure of 5%, for a total of 100% exposure on this one million dollar portfolio. There is therefor no leverage employed. This is a common way to construct a portfolio.
The Average True Range Percent (ATR%) column is a measurement of how much each stock normally moves on an average day. It’s a common estimator of expected daily price variation, and though simpler it will give a very similar result to standard deviation or other common methods. The column Expected Dollar Move tell you how many dollars will on average be gained or lost per day for each position, assuming that that volatility doesn’t change.
| Ticker | Price | Portfolio Weight | Dollar Amount | ATR% | Expected Daily Dollar Move |
|---|---|---|---|---|---|
| AAPL | 434.77 | 5% | 50,000 | 3.22% | 1,611 |
| ADM | 33.9 | 5% | 50,000 | 1.45% | 727 |
| AZO | 399.63 | 5% | 50,000 | 1.62% | 811 |
| BIIB | 197.51 | 5% | 50,000 | 1.62% | 808 |
| COG | 66.34 | 5% | 50,000 | 2.12% | 1,058 |
| EL | 65.18 | 5% | 50,000 | 1.71% | 856 |
| GME | 30.2 | 5% | 50,000 | 2.92% | 1,461 |
| HSY | 86.35 | 5% | 50,000 | 1.05% | 523 |
| IBM | 213.34 | 5% | 50,000 | 1.15% | 576 |
| LIFE | 65.54 | 5% | 50,000 | 2.08% | 1,038 |
| MA | 538.96 | 5% | 50,000 | 1.49% | 743 |
| MHP | 51.94 | 5% | 50,000 | 2.27% | 1,134 |
| MMM | 106.625 | 5% | 50,000 | 1.11% | 556 |
| NRG | 24.57 | 5% | 50,000 | 1.89% | 945 |
| NWSA | 30.9 | 5% | 50,000 | 1.59% | 793 |
| SWK | 79.47 | 5% | 50,000 | 1.69% | 847 |
| VMED | 49.8 | 5% | 50,000 | 1.49% | 743 |
| WDC | 50.8 | 5% | 50,000 | 2.40% | 1,201 |
| XL | 30.82 | 5% | 50,000 | 1.36% | 679 |
| XOM | 90.64 | 5% | 50,000 | 1.22% | 612 |
The obvious problem highlighted here is that this simple approach accidentally allocated risk very unevenly. The performance of such a portfolio will be driven by the volatile stocks. AAPL would have more than double actual risk than IBM. By thinking of risk in terms of exposure and leverage, the result was actually a rather random risk allocation.
Cross asset portfolios
While the problem is significant within a single asset class, it grows to Titanic proportions when you start dealing with cross asset investment strategies. In the CTA hedge fund business we deal with futures covering all asset classes, from stock indexes and bonds to commodities, currencies and interest rates. With such strategies, the concept of leverage goes right out the window. Just consider the next table to understand why.
| Name | Sector | Portfolio Weight | Dollar Amount | ATR % | Expected Daily Dollar Move |
|---|---|---|---|---|---|
| S&P 500 | Equities | 6.25% | 62,500 | 1.060% | 663 |
| Nasdaq 100 | Equities | 6.25% | 62,500 | 1.285% | 803 |
| Eurodollar | STIR | 6.25% | 62,500 | 0.018% | 11 |
| Fed Funds | STIR | 6.25% | 62,500 | 0.006% | 4 |
| Crude Oil | Energy | 6.25% | 62,500 | 1.985% | 1,241 |
| Gasoline | Energy | 6.25% | 62,500 | 2.200% | 1,375 |
| Lean Hogs | Meats | 6.25% | 62,500 | 1.230% | 769 |
| Live Cattle | Meats | 6.25% | 62,500 | 1.079% | 674 |
| Rough Rice | Grains | 6.25% | 62,500 | 1.646% | 1,029 |
| Corn | Grains | 6.25% | 62,500 | 2.346% | 1,466 |
| EUR/USD | Currencies | 6.25% | 62,500 | 0.851% | 532 |
| GBP/USD | Currencies | 6.25% | 62,500 | 0.694% | 434 |
| US 10 Year | Bonds | 6.25% | 62,500 | 0.404% | 253 |
| US 2 Year | Bonds | 6.25% | 62,500 | 0.036% | 23 |
| Gold | Metals | 6.25% | 62,500 | 1.400% | 875 |
| Copper | Metals | 6.25% | 62,500 | 1.800% | 1,125 |
This is a hypothetical cross asset portfolio where an equal notional dollar amount has been allocated to each position. With futures you can’t take as exact position sizes as with stocks, but we’ll simplify that part since it has no impact on the analysis.
There are 16 positions in this portfolio so we allocate a notional exposure of $62,500 to each of them. Using the same ATR% method of estimating the daily impact from each position, the result may surprise you. While corn would on a normal day gain or lose almost $1,500, the Fed Funds futures would have an average impact of $4. Yes, that’s how big difference it makes. On an average day, the corn would be 375 times more important for your bottom line than the Fed Funds.
What you’ll find is that the short term interest rates futures (STIRs) would have almost zero actual risk in the portfolio with this kind of exposure based sizing. That’s because these are markets where 0.1% in a day is a very big move. For markets like this to have a chance to contribute to the bottom line, they must be given a larger weight.
Clearly the method of allocating equal exposure is not a great idea in practice. Simply filling up with positions until you run hit 100% exposure or a certain leverage factor will result in a random risk. Let’s look instead at a more realistic approach to position sizes, by allocating risk instead of capital.
The next table has the same positions as the previous table, but with different sizes. Instead of aiming for an exposure level and taking whatever risk comes with that, we’ve turned it around here. We aim for a certain amount of risk and let the exposure land where it may. Again, the ATR% stands in as a crude estimator of risk. Feel free to replace with other volatility measures if you so please, the principle will still work.
In this table, the target is for each position to have a daily impact of $700 on an average day. That number is picked just to arrive at the same sum of the Expected Daily Move column as in the previous table. It makes for easier comparison, that’s all.
| Name | Sector | Portfolio Weight | Dollar Amount | ATR % | Expected Daily Dollar Move |
|---|---|---|---|---|---|
| S&P 500 | Equities | 6.60% | 66,038 | 1.06% | 700 |
| Nasdaq 100 | Equities | 5.45% | 54,475 | 1.29% | 700 |
| Eurodollar | STIR | 388.89% | 3,888,889 | 0.02% | 700 |
| Fed Funds | STIR | 1166.67% | 11,666,667 | 0.01% | 700 |
| Crude Oil | Energy | 3.53% | 35,264 | 1.99% | 700 |
| Gasoline | Energy | 3.18% | 31,818 | 2.20% | 700 |
| Lean Hogs | Meats | 5.69% | 56,911 | 1.23% | 700 |
| Live Cattle | Meats | 6.49% | 64,875 | 1.08% | 700 |
| Rough Rice | Grains | 4.25% | 42,527 | 1.65% | 700 |
| Corn | Grains | 2.98% | 29,838 | 2.35% | 700 |
| EUR/USD | Currencies | 8.23% | 82,256 | 0.85% | 700 |
| GBP/USD | Currencies | 10.09% | 100,865 | 0.69% | 700 |
| US 10 Year | Bonds | 17.33% | 173,267 | 0.40% | 700 |
| US 2 Year | Bonds | 194.44% | 1,944,444 | 0.04% | 700 |
| Gold | Metals | 5.00% | 50,000 | 1.40% | 700 |
| Copper | Metals | 3.89% | 38,889 | 1.80% | 700 |
Allocate risk, not cash
Targeting a daily impact is easy. First, use a volatility estimator to figure out how much the instrument normally moves in a day. In this case ATR% is used. The S&P showed an ATR% of 1.06%. If we allocate 66,000, the S&P futures will show a daily p&l variation of around $700 if the volatility is constant. (700 / 0.016 = 66,038)
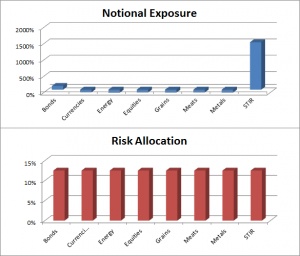
As you see, the position sizes are dramatically different. It looks like a typo, doesn’t it? Almost 400% exposure for the Eurodollar and near 1,200% for the Fed Funds. A 12 to 1 leverage on a single position, in a portfolio with plenty of other big positions.
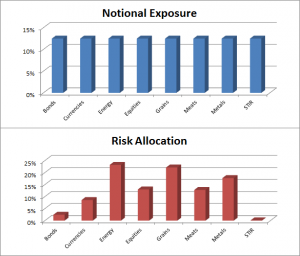
Well, I admit to including the Fed Funds just to make the example more extreme. Still, even the Eurodollar has a 4 to 1 leverage against the portfolio. Compare the notional exposure versus the risk allocation in the graph. Now we have approximately equal risk, but the notional allocation is quite different.
The total leverage on this portfolio is 18 to 1. That’s an exposure of 1,800%.
Now here is the key question.
Which portfolio out of the three carries the most risk?
My answer would be, the first one. The one with single stocks for a total of 100% exposure, using no leverage.
Now, before you start throwing eggs in my direction, consider this. If all positions have a normal day, moving the same amount as they normally do and in the same direction, the total profits or losses will be the same for all these portfolios. For the stocks however, you both have a concentration risk in a few high volatility stocks and the much more severe problem of having all positions in a single and highly correlated asset class. All your eggs are in one basket. Stocks have a very high internal correlation, and they tend to go up and down on the same day.
The second portfolio is diversified, holding many different asset classes. The problem is that the risk is concentrated on a few of them. The third portfolio spreads risk equally on a group of asset classes with low correlation to each other.
But a single position with 12 times leverage? Doesn’t that mean that we’ll be wiped out if that position loses 8%? Yes, it does. But worrying about the Fed Funds dropping 8% in a day is like worrying about the S&P hitting zero tomorrow. Both could happen but it would mean end of civilization as we know it. There are more realistic scenarios to worry about.
Leverage, by itself, is pointless. As a measurement, it tells you next to nothing about your risk. Allocate risk deliberately.
 Following the Trend




Quick note, I think you need an ‘s’ on the end of ‘tell’ in the last sentence.
From experience, the first one does not carry more risk. This is because correlations are unreliable, and most of the gains and losses in a portfolio are bent to the will of the overall market. That’s just stocks.
Since I assume most investors who actually adhere to systems set stops, what happens when they need to risk via stop placement 3-10x as much to get the same expected dollar movement as the rest of their portfolio? I’ve seen it happen.
You’d need a compromise, a normalization, a threshold, to keep it all in check.
My final thought, once again only about applying this to stocks, is that it’s wiser to throw expectations out the window, and that includes expected volatility. I think this falls into the trap of trying to predict the future, rather than just riding a trend and accepting movements.
Fantastic article. It’s a tragedy that rational position sizing doesn’t get more attention. The number of non-CTA investment/financial advisers that understand, let alone practice, volatility based position size calculations is probably well under 1%.
Great article. I’ve often thought the same thing when I hear the talking heads on TV trying to assess risk. It’s amazing how little the “experts” really know when it comes to managing true risk, I guess that’s why markets work the way they do.
Good writing Clenow. Assuming your stops can be executed (and that can be a challenge)the most relevant parameter is your initial risk. With that defined, the notional amount is
close to irrelevant. You have a point Matt, regarding talking heads.
how is correlation btwn the asset classes taken into account here?
Not at all, dc. It’s not required to make the point of this article. In reality, you might want to look deeper into that part though.
Just for the record, this post has become the inspiration for my now go-to order-sizing function. I have found that ATR order sizing is pretty fantastic. It starts getting slightly unraveled at longer time frames because the ATR computation gets stale, but that just means it needs to be rebalanced every so often (if trades run that long).
HI Andreas, what metric do CTA’s currently use to determine maximum exposure to an instruments? Is it VaR? IS is acceptable practice to use ATR as risk factor? IS there a resource where I can get more info on maximum gearing that trend following CTA’s typically use?
Different shops rely on different methods. Most medium to large shops use VaR to some extent but that doesn’t necessarily mean that it’s the primary risk allocation tool. It’s often more a risk control than a risk management tool.
I know of a great shop that uses m/e as the primary risk tool. Yes, that thought scares me too. But they are doing with very large funds with great results, so I guess it works if you do it right. I rely on in-house developed risk tools and I’d assume most CTA shops develop their own methodology. Stress testing is important to understand what might happen when things turn sour.
Most CTA funds probably don’t use ATR. Still, it’s not a bad estimator and I often find that ATR approaches give very similar end results as more complex methods. It’s a great estimator if you’re on a budget.
tx Andreas
Hi Mr.Clenow
Great article! My question isn’t really on allocating risk but on measuring risk. Would you have any insights into analyzing risks for shorter term or even intraday trading systems? Perhaps those that go long and short a few times on an average day if no strong trend is in place?
How would you measure risk in this situation? Take crude oil in portfolio 2 as an example. An ATR% of 1.985 and expected daily dollar move of 1241. Would ATR% and expected daily dollar move,assuming that volatility doesn’t change, still be relevant in dollars gain or loss on an average day? Since in between that 1.985% movement, I may have went long and then short a few times during the day.
Thanks,
Frankie
Hi Frankie,
This way of measuring risk is a simplification of course, but good enough for most position traders. For intraday strategies however, the logic breaks down fast. The daily ATR isn’t helpful if your holding period is an hour.
I don’t do intraday strategies, mainly due to the operational overhead that comes with that game. The first thing I’d try though is to apply the same concept, but on an intraday basis. You could calculate your ATR on five minutes data for instance. Since vola can change quicker in that game, I’d calculate multiple ATR’s on different time frames and time windows. Build a method to find the worst case, or at least bad case number. Since open and close are not very relevant for intraday, you might want to switch to standard deviation or similar too. Find what the highest intraday vola was in your lookback period, what the average was and what the current is. Based on that, you should be able to come up with a decent position sizing.
Hi Mr Clenow,
Yes perhaps something like looking into shorter term timeframes ATR and calculate based on that would provide some insight. I’ve been trying to come up with some new ways to measure risk for my intraday strategies but have no luck so far in coming up with something useful and practical.
Great book by the way. I read it over a year ago and actually created a few strategies that are profitable even until now. Based on those rules in your book, but trading off of a slightly shorter timeframe. I added different types of exits to cover different market conditions, additional trade management rules as well as a new set of entry requirement if past volatility indicates tight choppy market.
Frankie
Great article. Back to Francoise’s question, is there a public site to find notional exposures of CTAs?
Thank you, Jill
Sorry for the late reply, Jill. Busy summer…
I don’t believe you’ll find such numbers. They’re usually not reported, at least not in any standardized manner. If you contact a fund directly, they should answer you, at least approximately. The larger ones usually give out data on historical exposure and other measurements if you ask politely (or if you’re a large potential investor…)
If you spend a bit of time doing reverse engineering of a fund’s return profile, you can also estimate their notional that way. Funds with a tilt towards the rates sector will naturally have a significantly larger notional exposure than the more commodity geared funds. That of course, says nothing about their relative risk.
Hi Andreas,
first, congratulation on your book. I liked it a lot and it’s the best book I’ve read about futures and trend following.
Well, I have a question that I’ve been struggling for a while and it may looks like simple, but I’m not so sure.
Why diversify so much if our markets are so correlated? S&P, Nasdaq, other indexes move together, usually in opposite direction of gold and commodities and interest rates.
I have a trend following system that trades only ibovespa (Brazil) futures and it is working well. So, why diversify, if the system gives you the right entry/exit points?
Thanks in advance for the response
Hi Eduardo,
Diversification is critical over time. You’re right that if you trade highly related markets, like the S&P and NDX, you won’t find too much diversification. Trading both is slightly better than trading one, but marginally. If you trade only stocks, you’ll run into this problem all the time.
Right now, trend following on equities is working great. That’s because we’ve got a bull market. There may be a period where trend following on equities just doesn’t work for a year or more. It probably still works for something else at that time though.
It’s dangerous to make generalized assumptions about correlations. Better to constantly measure it. Gold and rates usually doesn’t have that much correlation to equities. Looking right now at my way of calculating a 50 day correlation, I’m getting a correlation coefficient of -0.06 between gold futures and S&P futures. That is, no actual correlation at all. If I look at 100 days, I get -0.30, a slight negative correlation.
Diversification will help you survive in the long run. If you don’t diversify, you’re relying on a bit of luck that your model will keep working on that particular market.
Hi Andreas,
Great book indeed!
Just got it and I really like it.
About correlation: here is a correlation table that I put together using gdocs http://goo.gl/hm9Aj8 . I use 84d (natural log pt/pt-1) which correspond to about 4 months as described in this interesting FAA paper http://goo.gl/SeyuGw . Looks like traders use different look-back period for correlation, though most seem to be between 50d and 100d.
Andreas,
Brilliant piece and incredibly well articulated. You have a very clear and precise way of explaining these topics that really showed through in your book and in analysis like this above.
I’ve learnt (via teaching music in the past) there are two types of experts in this world, one that has mastery but can’t remember how they got there and therefore find it difficult to articulate to someone the steps required to achieve proficiency.
The other is someone who has mastery but can articulate the steps involved in gaining mastery AND communicate effectively to others.
You are the latter in my opinion and I think that is a rare commodity… chapeau.
Simon
Thanks, Simon! I’m not sure about the mastery part though, but I do my best.
The communication part is interesting. I know a few people whom I consider to be some of the very best in the world in our field. They have reached levels of achievements far beyond what I’m capable of and in most cases they have amassed sizable fortunes along the way.
However, their biggest difficulty is to explain what they do. Since they tend to be hedge fund managers, explaining what you do tends to be a very large part in raising assets. If you can’t communicate your strategy clearly, you’ll find it very difficult to get larger tickets no matter how good your performance is.
Well, at least one thing’s for sure. I have the musical abilities of an averagely cow.
It’s a symphony, and the symphony only sounds good over the course of the entire concert when all the instruments are playing their roles. And there are some times when the violins stop playing for a while, and that’s okay, because this is a time in the piece where the woodwinds or the horns are being emphasized, and that’s fine.
Jason Gerlach – Sunrise Capital Management via Top Traders Unplugged
Hello Andreas,
I would like to ask to know how do you choose your markets when you are building your portfolio, you make a selection of all representative( and liquid) sectors then you build your portfolio or you look for sectors where there are grounds for trend. My concern is that predicting movements on markets is just pointless so basing yourself on fundamentals, you might be eventually right, but you will be most of the time wrong in its timing. So for me, either you stay in all these selected markets all the time and wait for the trend, either by taking in small losses then catch the move or find some king of filter before entering a market. Do you have a preference?
I am planning to subscribe for your report soon, do you know if we can API the data from the report because i like to code my own dashboard on MATLAB? Is it possible? I have also one question, have you heard about the platform AlgoTrader, its a Zurich based company, and their product looks pretty serious, its JAVA based.
Thank you again for the answers.
Dave
I use different methods for different types of models. The report on this site covers all relevant markets, or at least a lot of them. I don’t really take fundamentals into account, though the term structure could be useful.
Regarding API, it might be possible depending on what kind of data you’re looking for. I already have my own, internal API’s in place for the website. Everything spins on php scripts, fetching data from a MySql and displaying with JS.
Never heard of AlgoTrader. They seem to be based down in Schwyz. I just checked their website, and I don’t know any of the people behind it. No opinions on them at all, in either direction.
Hi Andreas,
This is a great article. It’s the first time I’ve visited your site, but I’ll be back.
You’ve even persuaded me to buy one of your books – now I just have to decide which one.
I’ve submiited the post to the UKFinanceOver30 sub-reddit – https://www.reddit.com/r/UKFinanceOver30/
I’ve also added you to our list of favourite blogs.
Thanks again,
Mike
Hi Andreas,
Good article .. Isn’t this an example of Parity Risk? I’ve seen arguments for and against it; do you think it’s a worthwhile approach or the latest trend in the industry as it only really became popular after the 2008 crisis?
Also, your ATR% seem to show the decimals rounded up to the nearest 2 on the table – some must actually be lower as when I replicated this the Fed Funds had a dollar amount of $7 mill and a Portfolio Weight of 700% for example.
Just slightly different to yours, so that’s the only thing I can think of! Also, you put ‘(700 / 0.016 = 66,038)’, shouldn’t it be 700 / 0.0106 for the S&P Futures?
Funnily enough when I checked out the S&P future on my platform the ATR % was pretty much still around the 1.06% mark today … over two years later!
Oh, it’s absolutely risk parity, Ben. But if I wrote an article called “The merits of risk parity position sizing” approximately 7 people would read it. This article has almost 40’000 readers so far.
Well, actually, risk is a dangerous word. Technically, it’s volatility parity. But who keeps track.
Very true. To be fair this is the most detailed explanation of how it works at a high level that I’ve found online at least.