How many markets do you follow? Are you aware of the ongoing trends across all asset classes?
It’s difficult to keep up with the trends and easy to forget some markets. Perhaps you haven’t been looking at the soybeans in a few months, and you completely missed out on a massive rally. There’s a new page in place on this site just for this purpose.
The new Trends of the World page is build with diversified trend traders in mind. This page is generated daily based on a display that I create for my own use and review every morning. This screen, if used right, can save you hours of work every day. Here’s what it tells you.
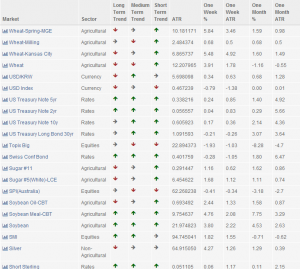 For each one of nearly 150 global futures markets, you can get a quick overview of trending direction. The trends are shown on three different time horizons. These trend indicators are calculated using Bollinger bands with 0.5 standard deviation bands. The long term uses 200 days, medium term is based on 50 days and short term on 20 days. The trend is deemed positive if the current price is more than half a standard deviation above the moving average and negative if more than half a deviation below. The area in the middle is considered neutral ground.
The display also shows you the current ATR, based on 90 days. This is expressed in the base currency of each instrument, and is commonly used for position sizing by futures traders. It tells you how much, on average, a market moves up or down in a day.
The final four columns are performance indicators. It shows how many percent each market moved in the past week or month, as well as putting that move in relation to the ATR. The latter is a more useful measurement than percent. If a market has moved three percent in a week, that doesn’t tell you as much as if it moved three times its ATR in a week. It puts the performance number into a more useful context.
Finally, if you click on any of the markets, you’ll get a neat chart and some metadata about each futures market. I’m considering adding a position size calculator and a few other potentially useful gadgets. But let’s see if you guys out there will make use of this trend dashboard first. If you like it and want to see more, send the link around. If enough people use this page, I’ll build more automated analytics pages.
Oh, and this display is updated daily. Automagically. Straight from my own dashboard.


Andreas, great job, thank for sharing your wisdom and thoughts with the rest of us for free.
Please keep it up, although my fund did not pick up, but am very much interested to stay involved in the subject. Thanks again.
Andreas, I read regularly your blog on Saxobank webpages. Your book is excellent. I am not going to create hedge found, but maybe my trading will be better when I know more. And after long introduction short question: why do you use Bollinger bands to measure trend and not bands based on ATR (Starc or Keltner) ?
Krzysztof
Thanks for your comments, guys.
Regarding indicator choice: Because it’s simple and works. I’m on the opinion that indicators are immensely overrated. The obsession with finding the right indicator is based on myth sold to hobby traders by people who never really traded. What’s important is overall concepts. What exact tool you use to measure or implement a concept is not really that important.
It’s like this endless debate about which of ten or more different types of moving averages is the best. Makes me think of the classic discussion in Stand by Me about whether or not Mighty Mouse can beat up Superman.
What you’ll find is that very few hedge fund professionals have even heard of Keltner, Starc, adapting averages etc. It’s just not important enough. These things mostly serve to distract retail traders from actual research, and to sell books/seminars/trading systems, of course.
It’s not that these indicators are necessarily bad. But the chance of them making a significant difference is very slim.
Trust your concepts and find good ways to implement them. Don’t spend too much time with indicators. Most of them are just made up by some unknown guy who tweaked some formula just to get famous by naming an indicator after himself.